Disaster Risk · Remote Sensing · GIS

Flood Extent & Vulnerability Mapping
Anambra West, Anambra State

Study Area Anambra West LGA, Anambra State
Total Area 740.031 km²
Period 2018, 2022, 2024
Primary Sensor Sentinel-1 SAR (VH Polarization)
Platform Google Earth Engine + ArcGIS Pro
356.7 km² flooded in 2022 (peak year)
48% of district inundated at peak
9 AHP vulnerability factors
3 flood years compared

Background & Objectives

Anambra West Local Government Area lies along the Niger River floodplain in southeastern Nigeria, making it one of the most flood-exposed districts in the country. Annual flooding, particularly during the October peak season, displaces communities, damages farmland, and disrupts livelihoods across the district's 13 wards.

This project combined multi-temporal Sentinel-1 SAR flood extent analysis with AHP-based vulnerability mapping to produce a comprehensive picture of both where flooding occurs and which areas face the greatest long-term risk. The analysis covered three flood years: 2018, 2022, and 2024, enabling direct comparison of flood severity across time.

The 2022 flood event stands out as the most severe in the study period. With 356.7 km² of the district inundated — nearly half the total land area — it aligns with the nationally documented catastrophic flooding that affected millions across Nigeria that year.

The vulnerability component goes beyond extent mapping to identify areas structurally prone to flooding regardless of year, using nine physical and socioeconomic conditioning factors weighted through the Analytical Hierarchy Process. The result is a five-class risk zonation map that can directly support emergency planning and land use decisions.

Multi-year flood extent comparison

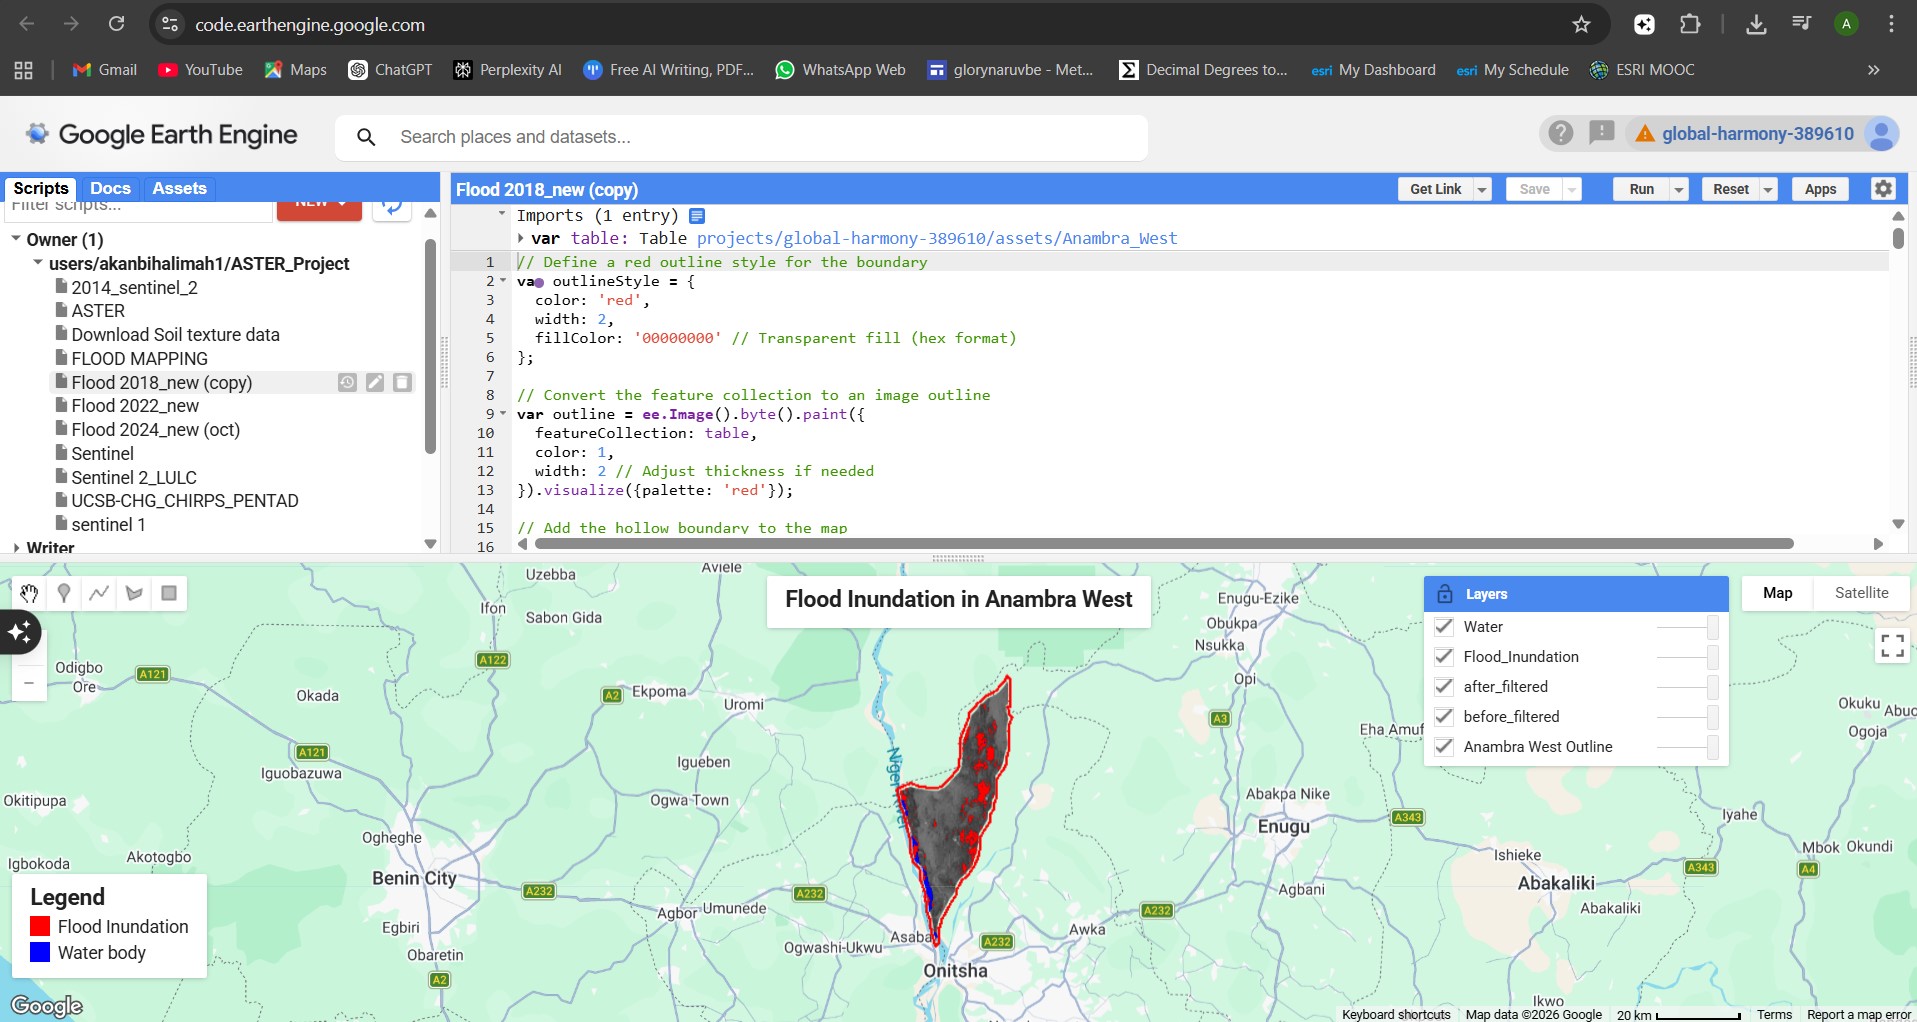
Sentinel-1 SAR imagery (VH polarization) was processed on Google Earth Engine to delineate flood extent for each study year. Pre-flood images were acquired in January (dry season) and post-flood images in October (peak flood season) for each year.
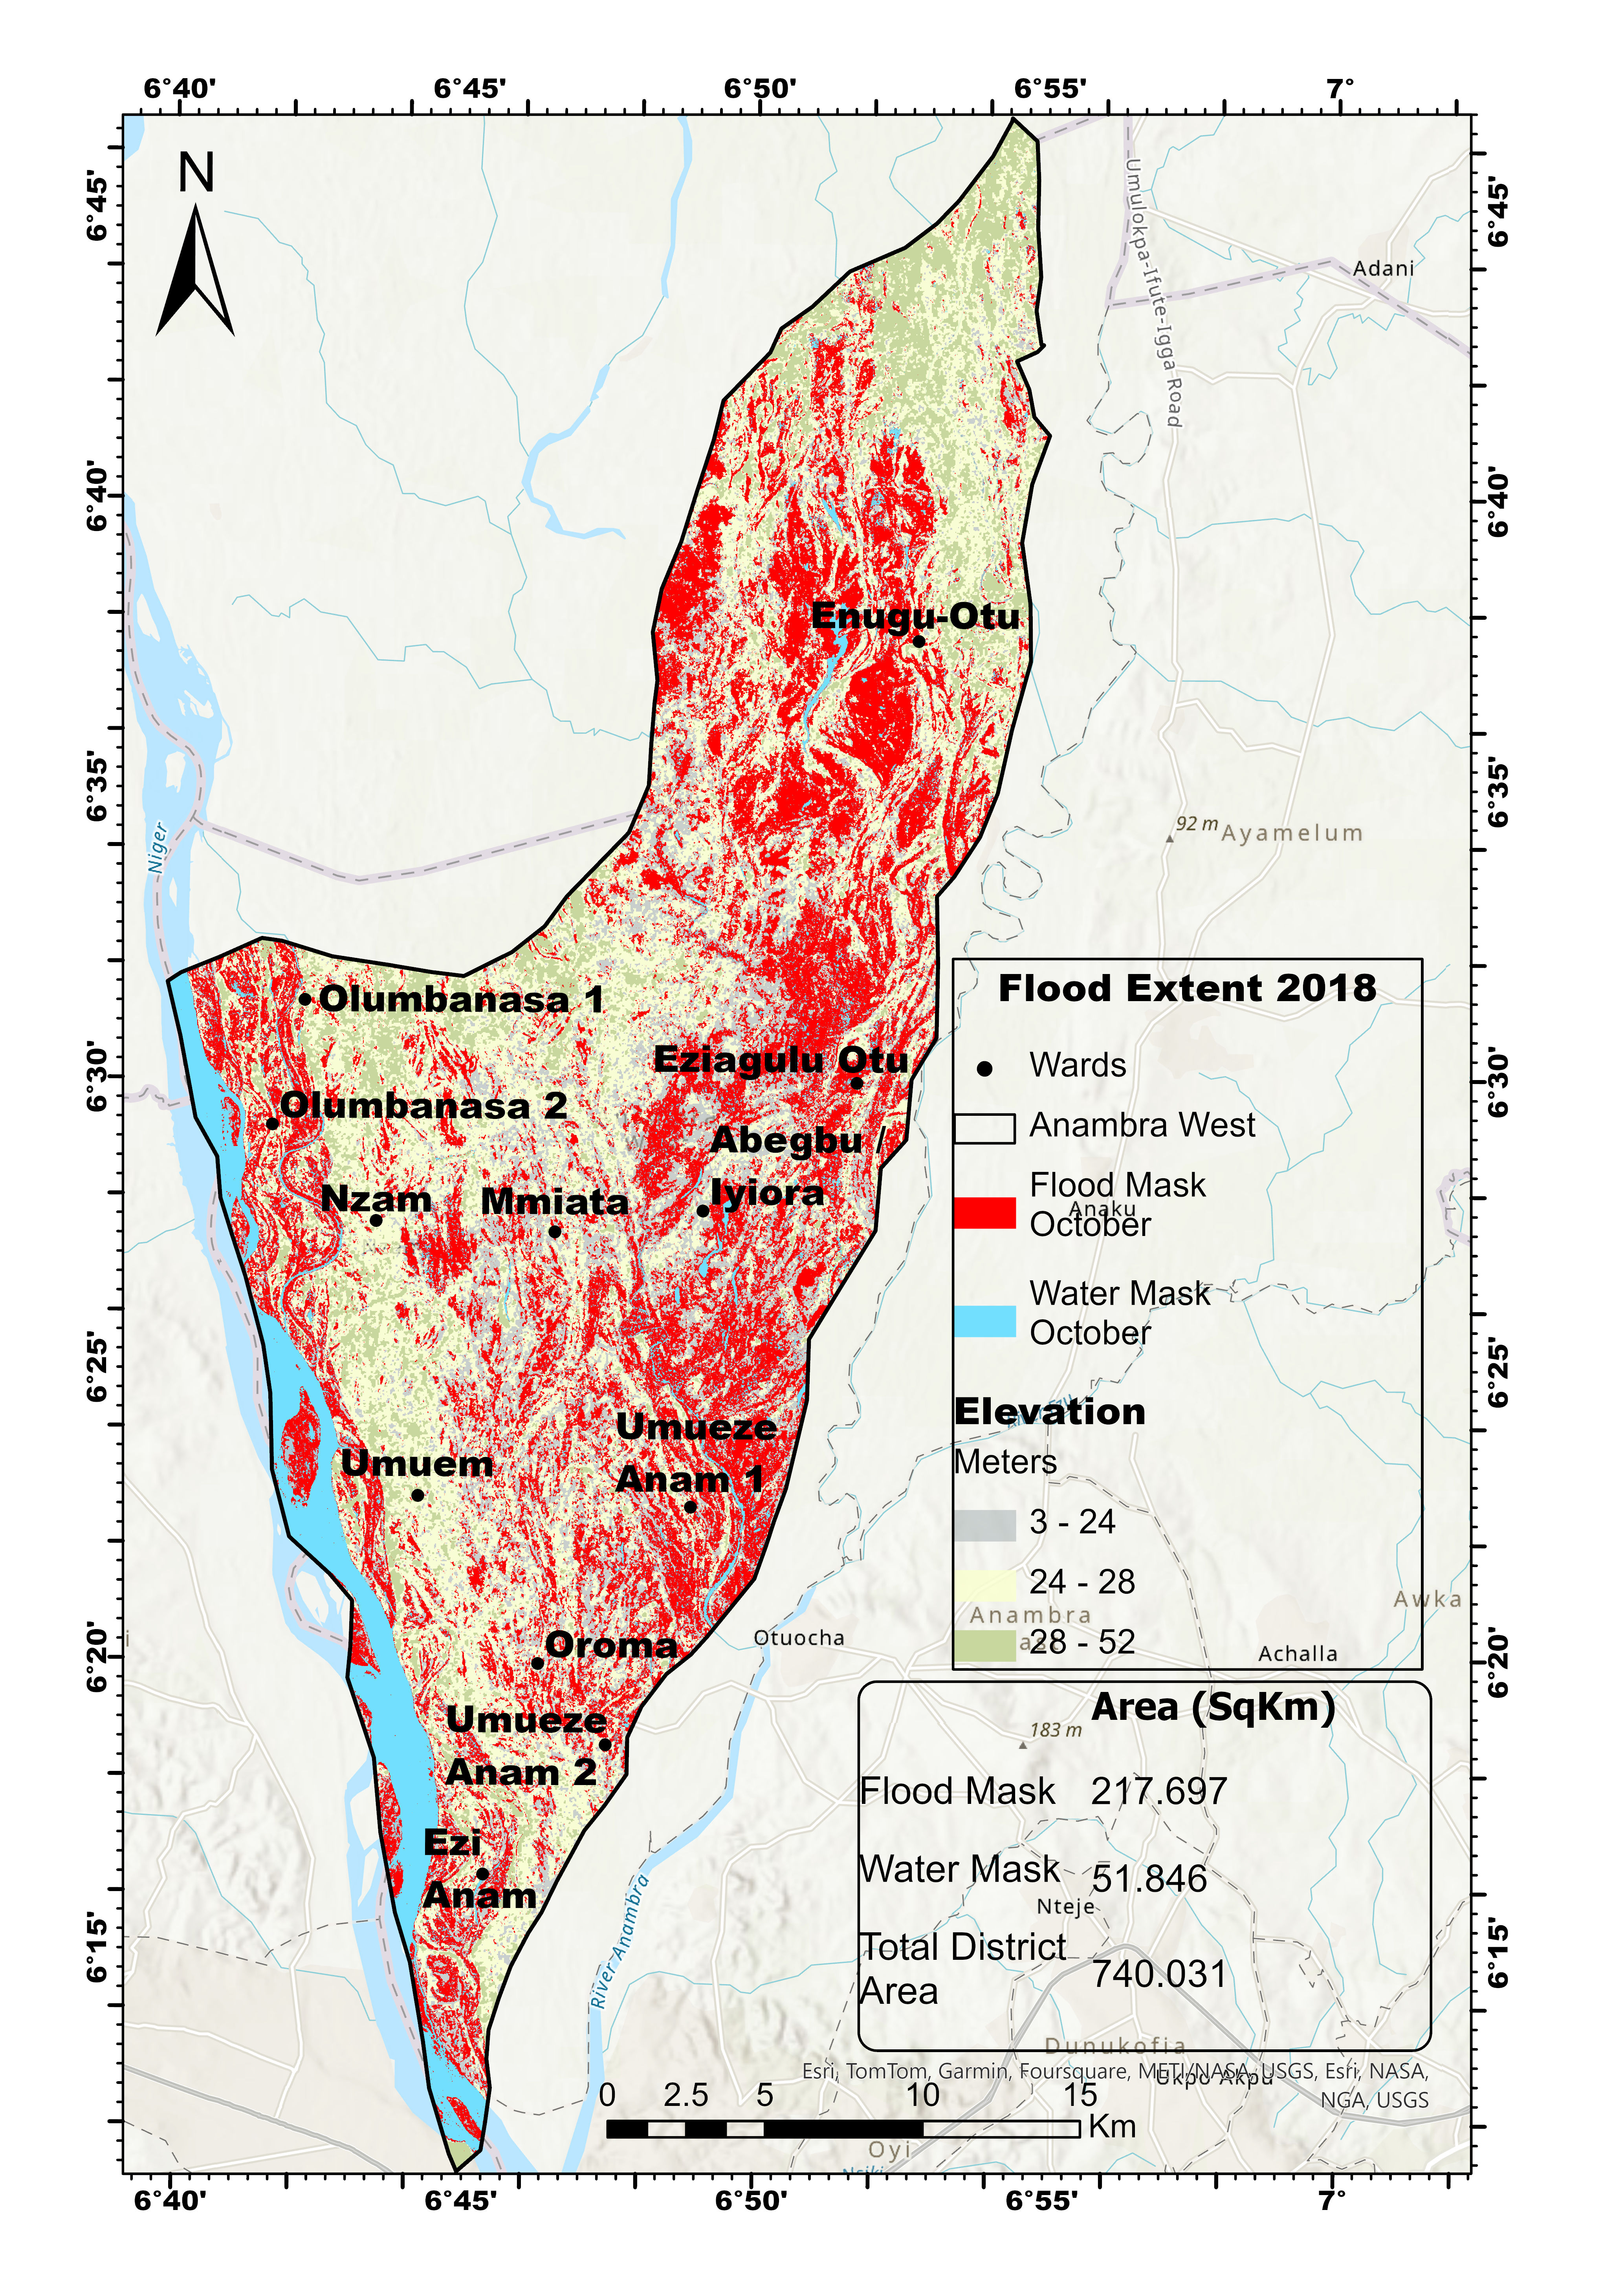
Flood Extent 2018 — Anambra West
Flood Extent 2018
217.697 km² flooded (29% of district)
Flood Extent 2022 — Anambra West
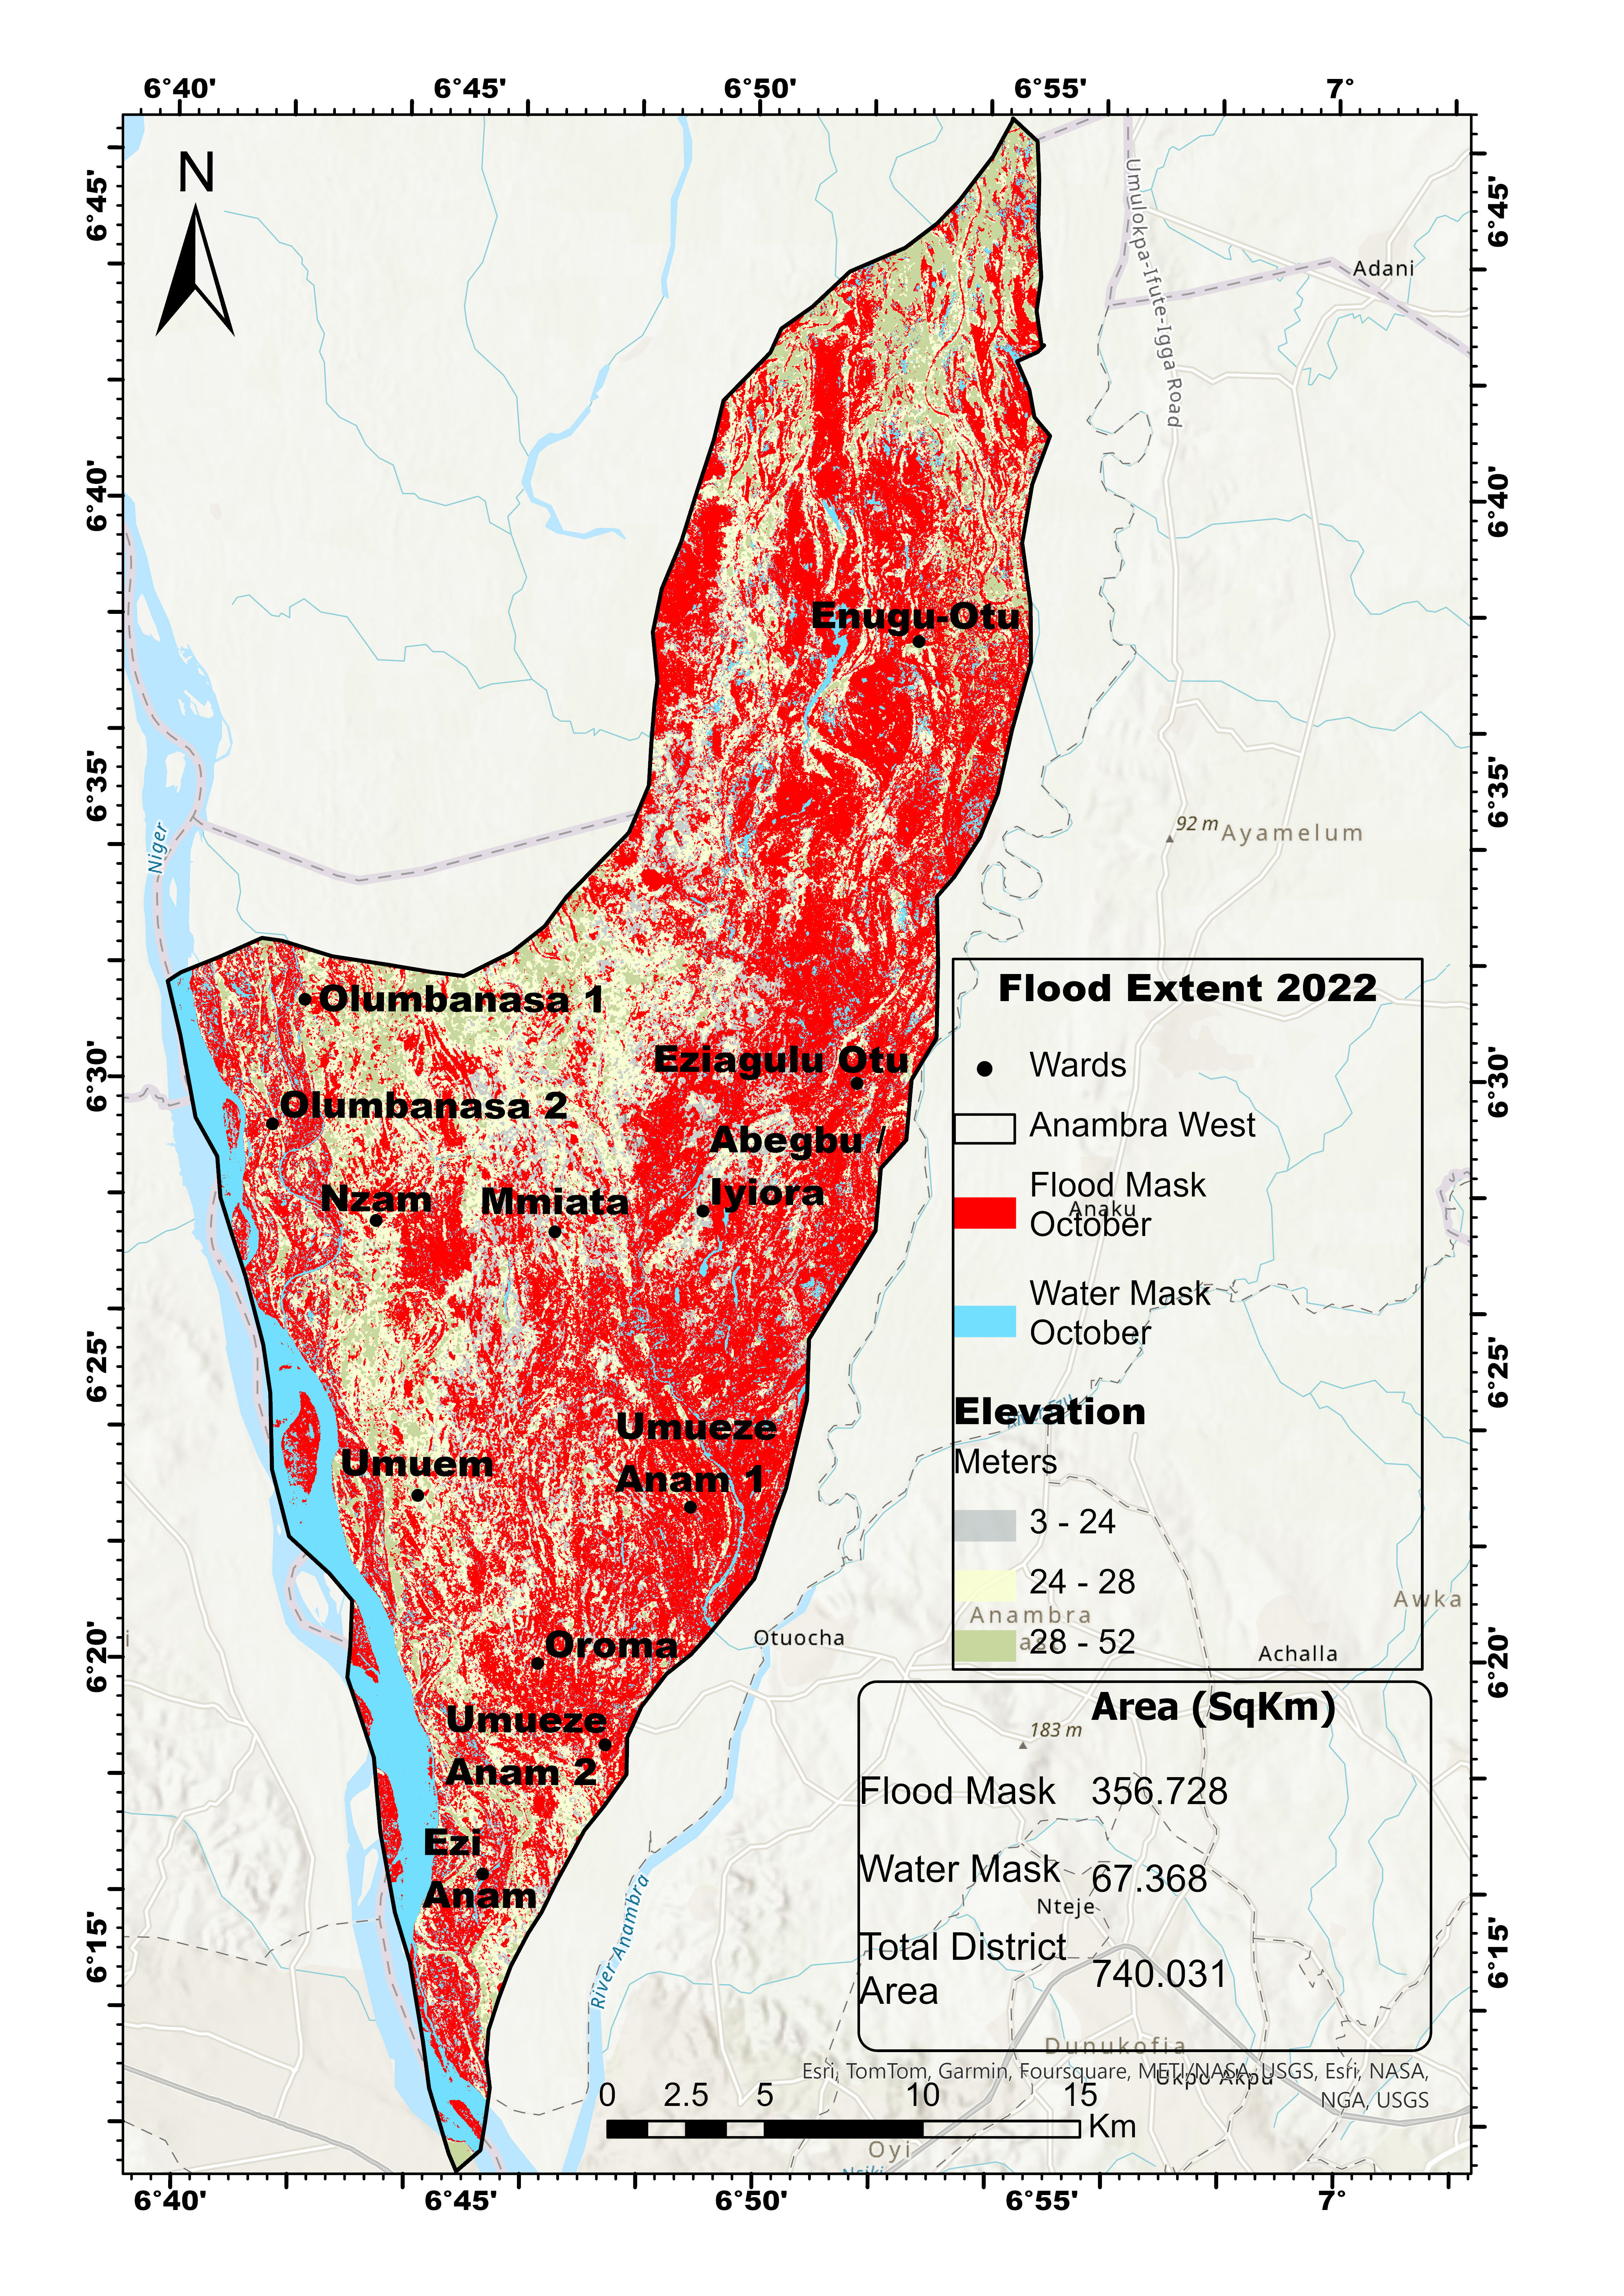
Flood Extent 2022 — Peak Year
356.728 km² flooded (48% of district)
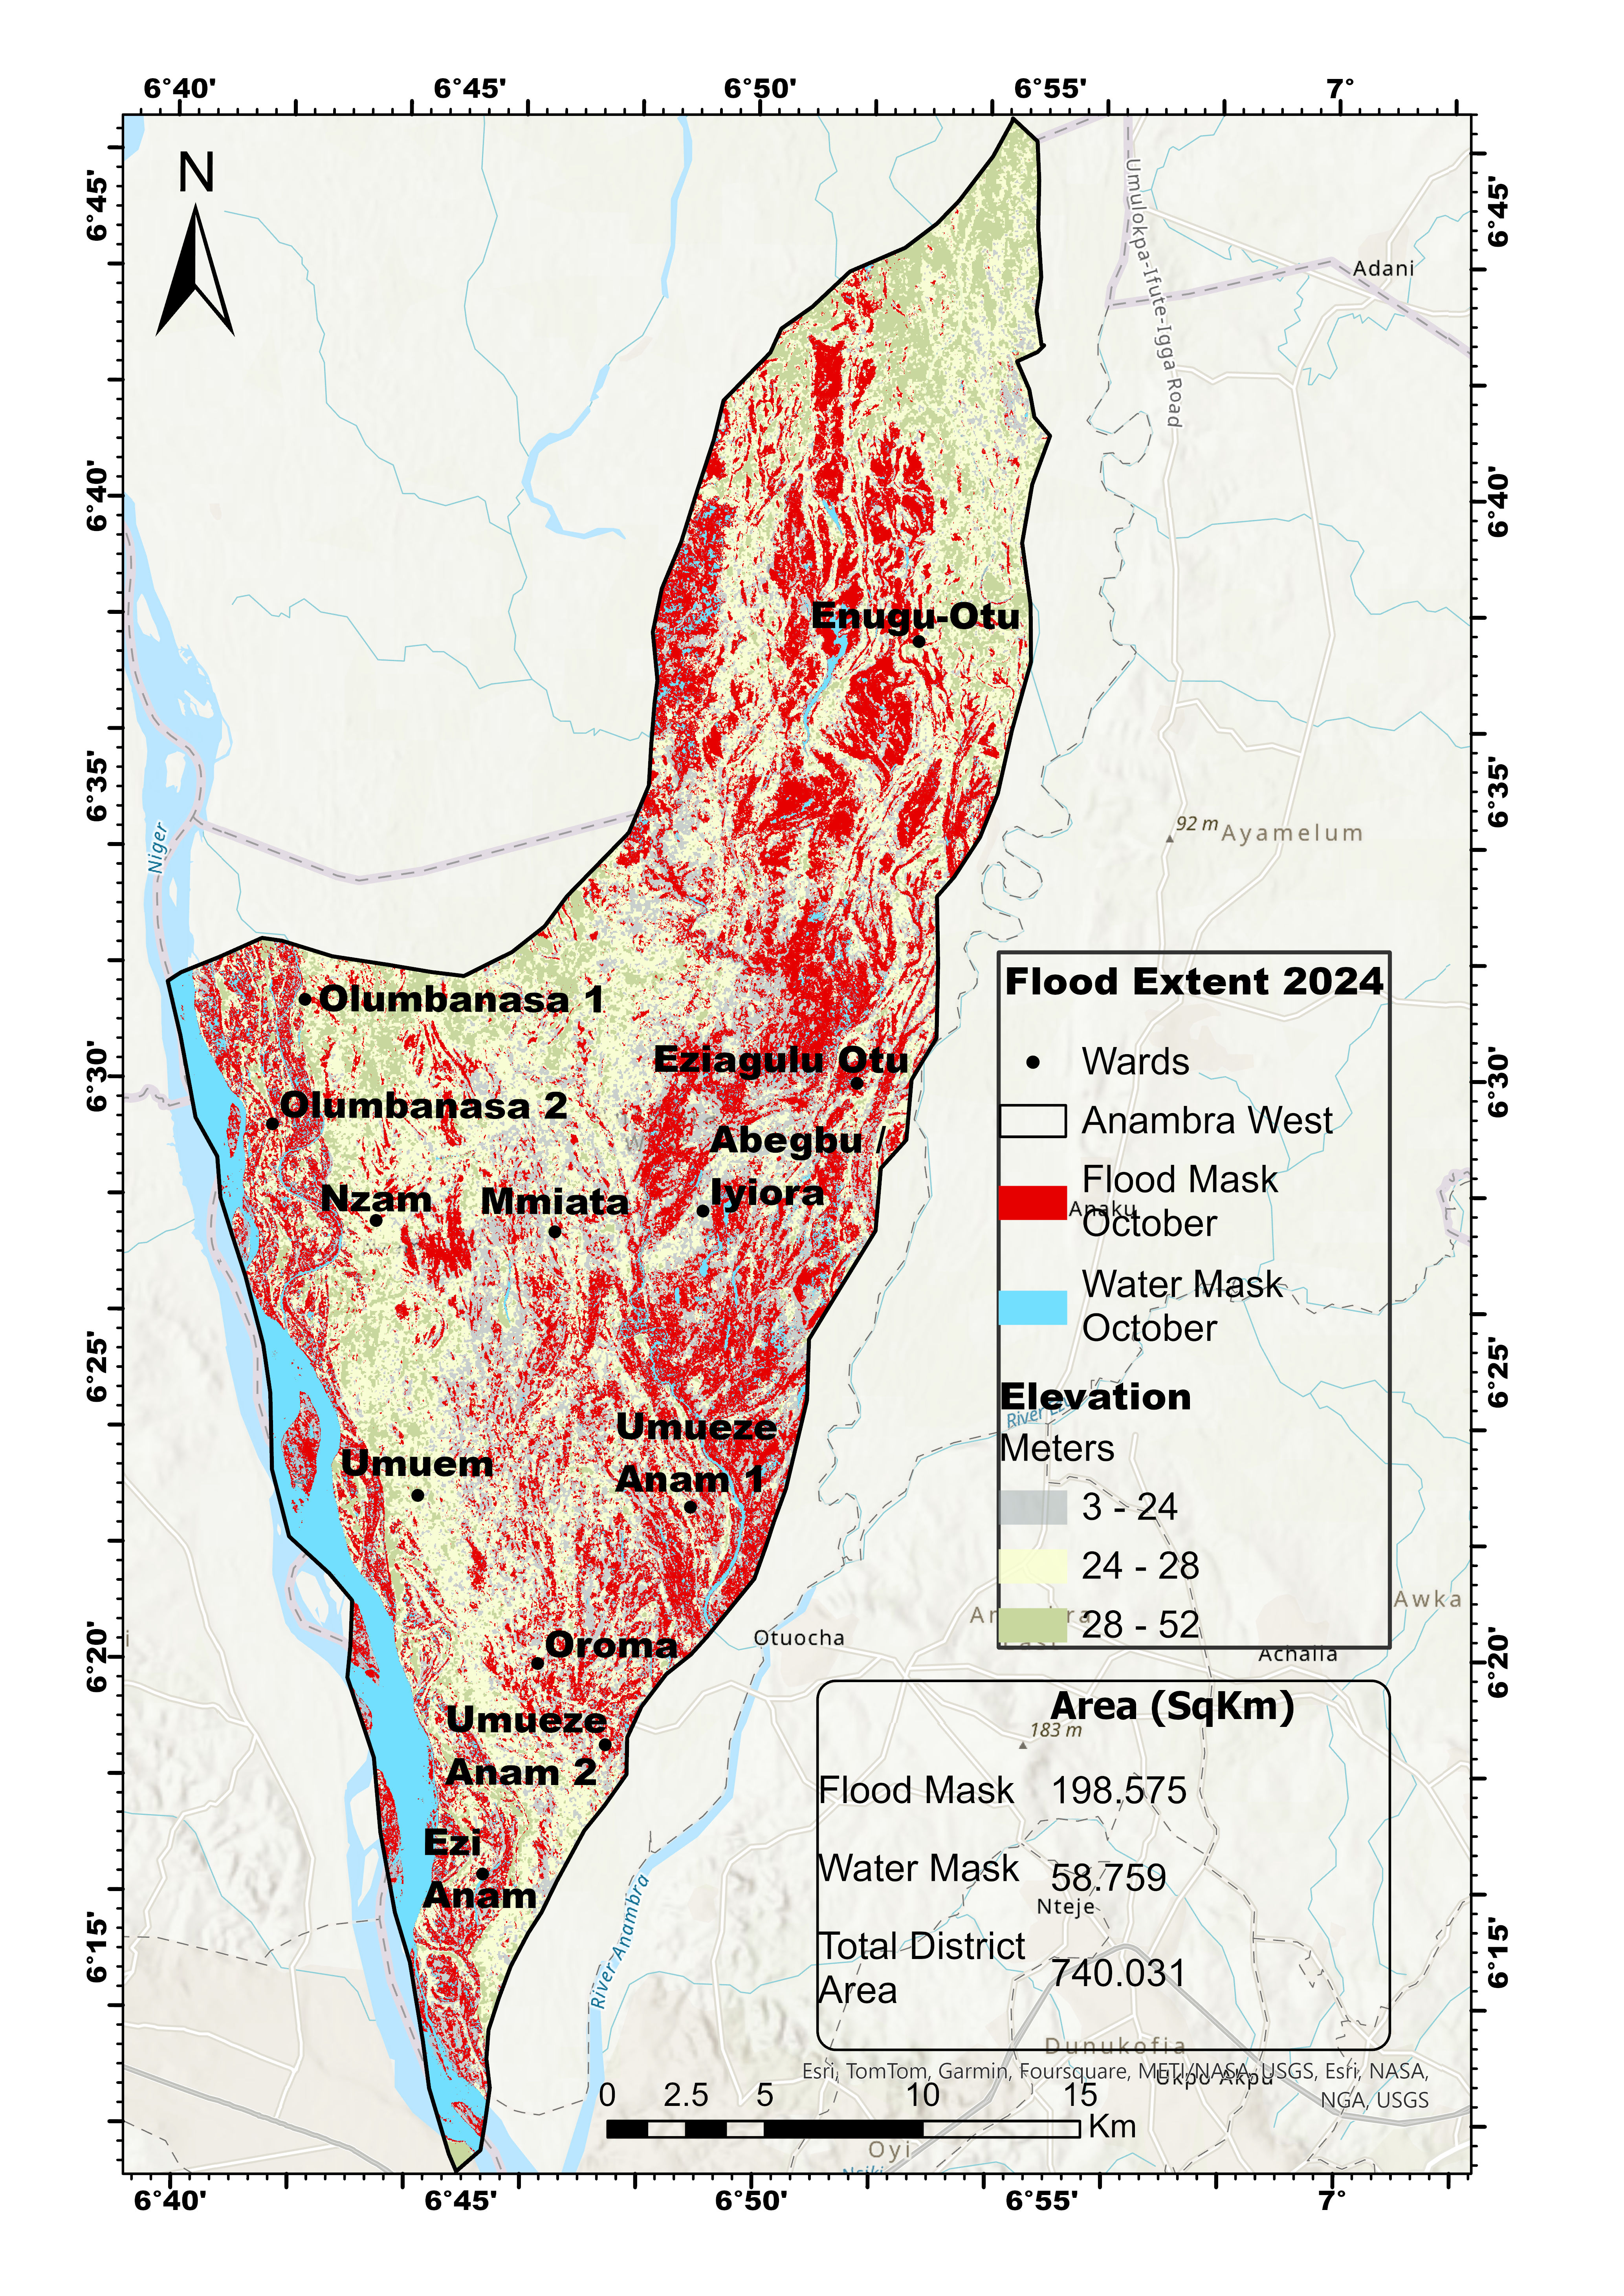
Flood Extent 2024 — Anambra West
Flood Extent 2024
198.575 km² flooded (27% of district)

Flood vulnerability zonation

Nine conditioning factors were reclassified into five vulnerability classes and combined using AHP-derived weights to produce the final flood vulnerability map. The southern wards — particularly Ezi Anam and Umueze Anam — and the Niger River corridor show consistently Very High vulnerability, reflecting their low elevation, proximity to water bodies, and high drainage density.

Flood Vulnerability Map — Anambra West
Very Low
Low
Moderate
High
Very High
AHP-weighted vulnerability zonation · 5 classes

Data & analytical approach

Data Source Resolution Use
Sentinel-1 SAR Copernicus Hub 10m Flood extent mapping (VH polarization, 2018 / 2022 / 2024)
SRTM DEM USGS Earth Explorer 30m Elevation, slope, TWI, drainage density, distance to water bodies
Sentinel-2 LULC ESRI Living Atlas 10m Land use / land cover factor layer
Population Density WorldPop via EarthMap 100m Socioeconomic vulnerability factor
Soil Data EarthMap (100cm depth) Soil type factor layer
Precipitation Climate Engine 4.5km Rainfall factor for vulnerability modelling
Administrative Boundaries GRID3 Nigeria Study area delineation and ward mapping
Google Earth Engine ArcGIS Pro Sentinel-1 SAR SRTM DEM AHP Weighting Weighted Overlay Raster Reclassification Vector Conversion Speckle Filtering

The flood extent analysis was coded and executed directly in the Google Earth Engine JavaScript API, combining Sentinel-1 imagery with the study area boundary asset to delineate flood inundation and water bodies.

Flood inundation analysis in Google Earth Engine
Google Earth Engine — Flood inundation script (2018), showing water body and flood mask layers over Anambra West boundary

What the analysis revealed

48%

The 2022 flood was the most severe event recorded in the study period, inundating 356.7 km² — nearly half of Anambra West's total land area, consistent with the national flood emergency declared that year.

64 km²

Difference in flood extent between the worst year (2022) and the least severe (2024), demonstrating significant year-to-year variability and the importance of multi-temporal monitoring rather than single-event assessment.

South

Southern wards, particularly Ezi Anam and Umueze Anam, consistently show Very High vulnerability across both the extent and AHP analyses, driven by low elevation and direct proximity to the Niger River and River Anambra confluence.

9 factors

The AHP vulnerability model integrated TWI, elevation, slope, drainage density, LULC, soil type, population density, distance to water bodies, and precipitation — providing a comprehensive multi-factor risk picture beyond simple inundation mapping.

← Return to Portfolio