Results — Coverage Maps
Spatial distribution of ITN indicators
All indicators were computed per LGA and mapped as choropleth layers. The contrast between Kano (generally moderate to high access) and Kaduna (predominantly critical to low across all indicators) is the defining spatial pattern of this analysis.
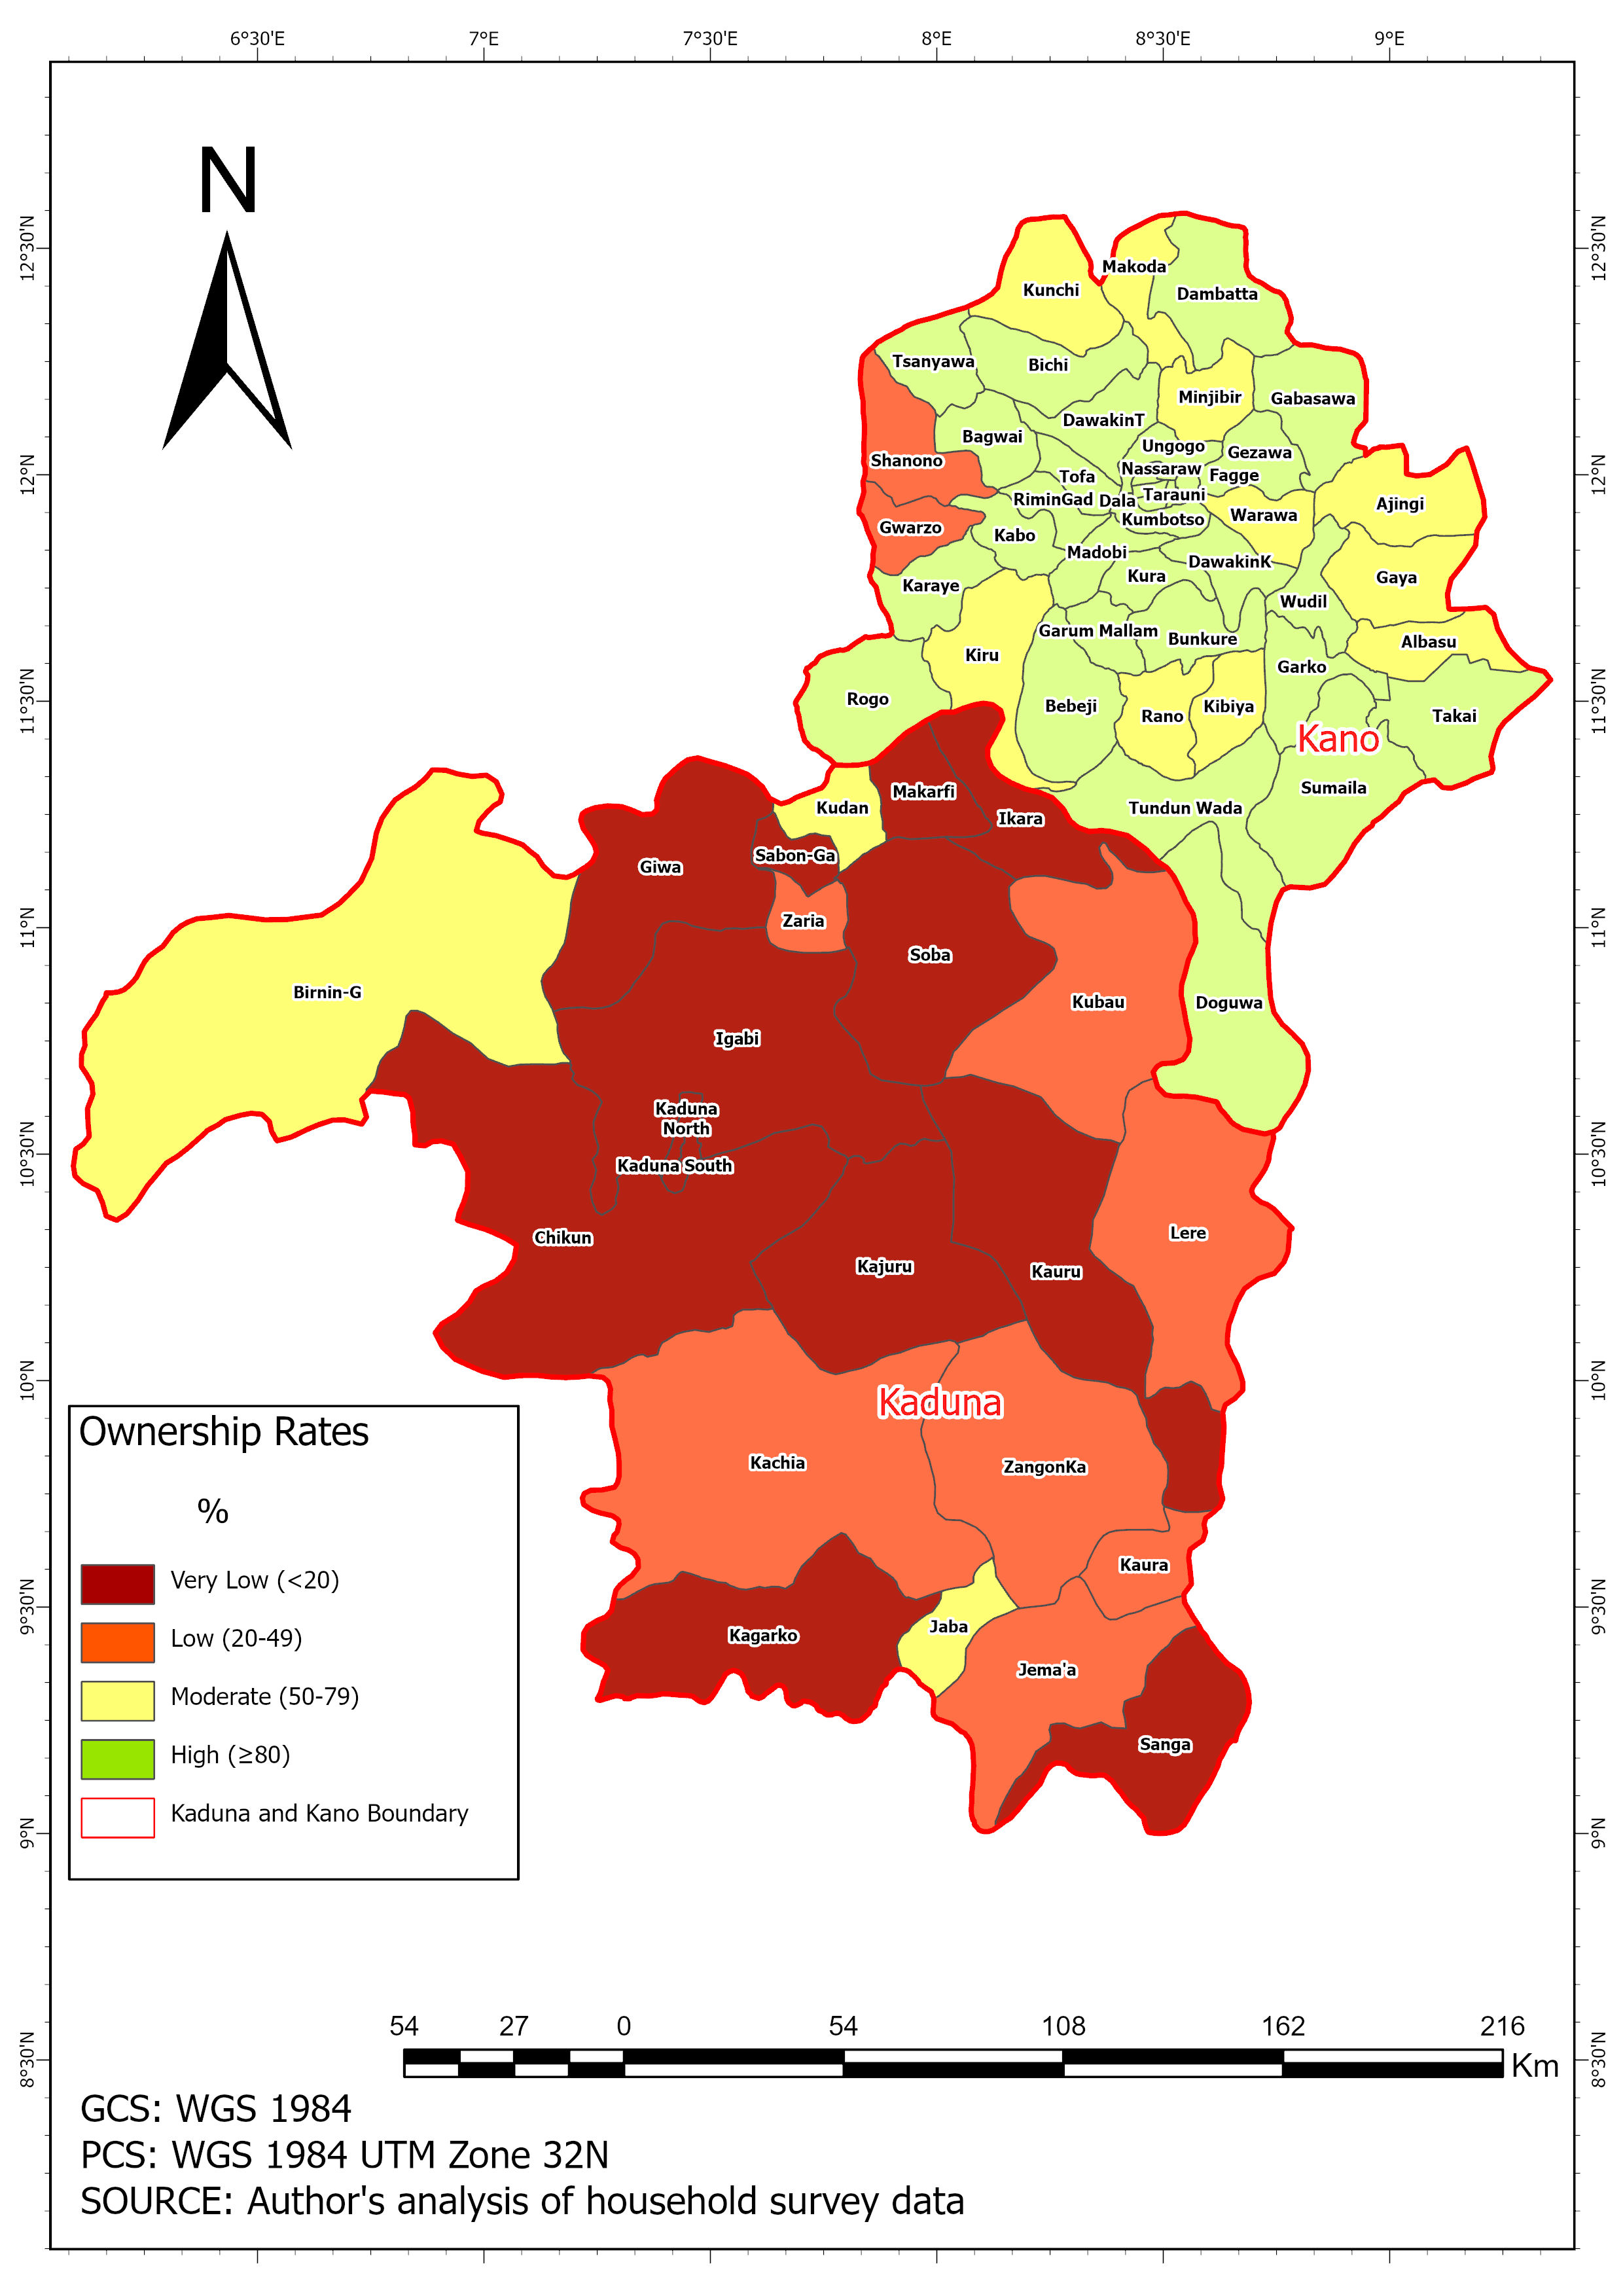
Indicator 01
Ownership Rate
Very Low (<20%) to High (≥80%)
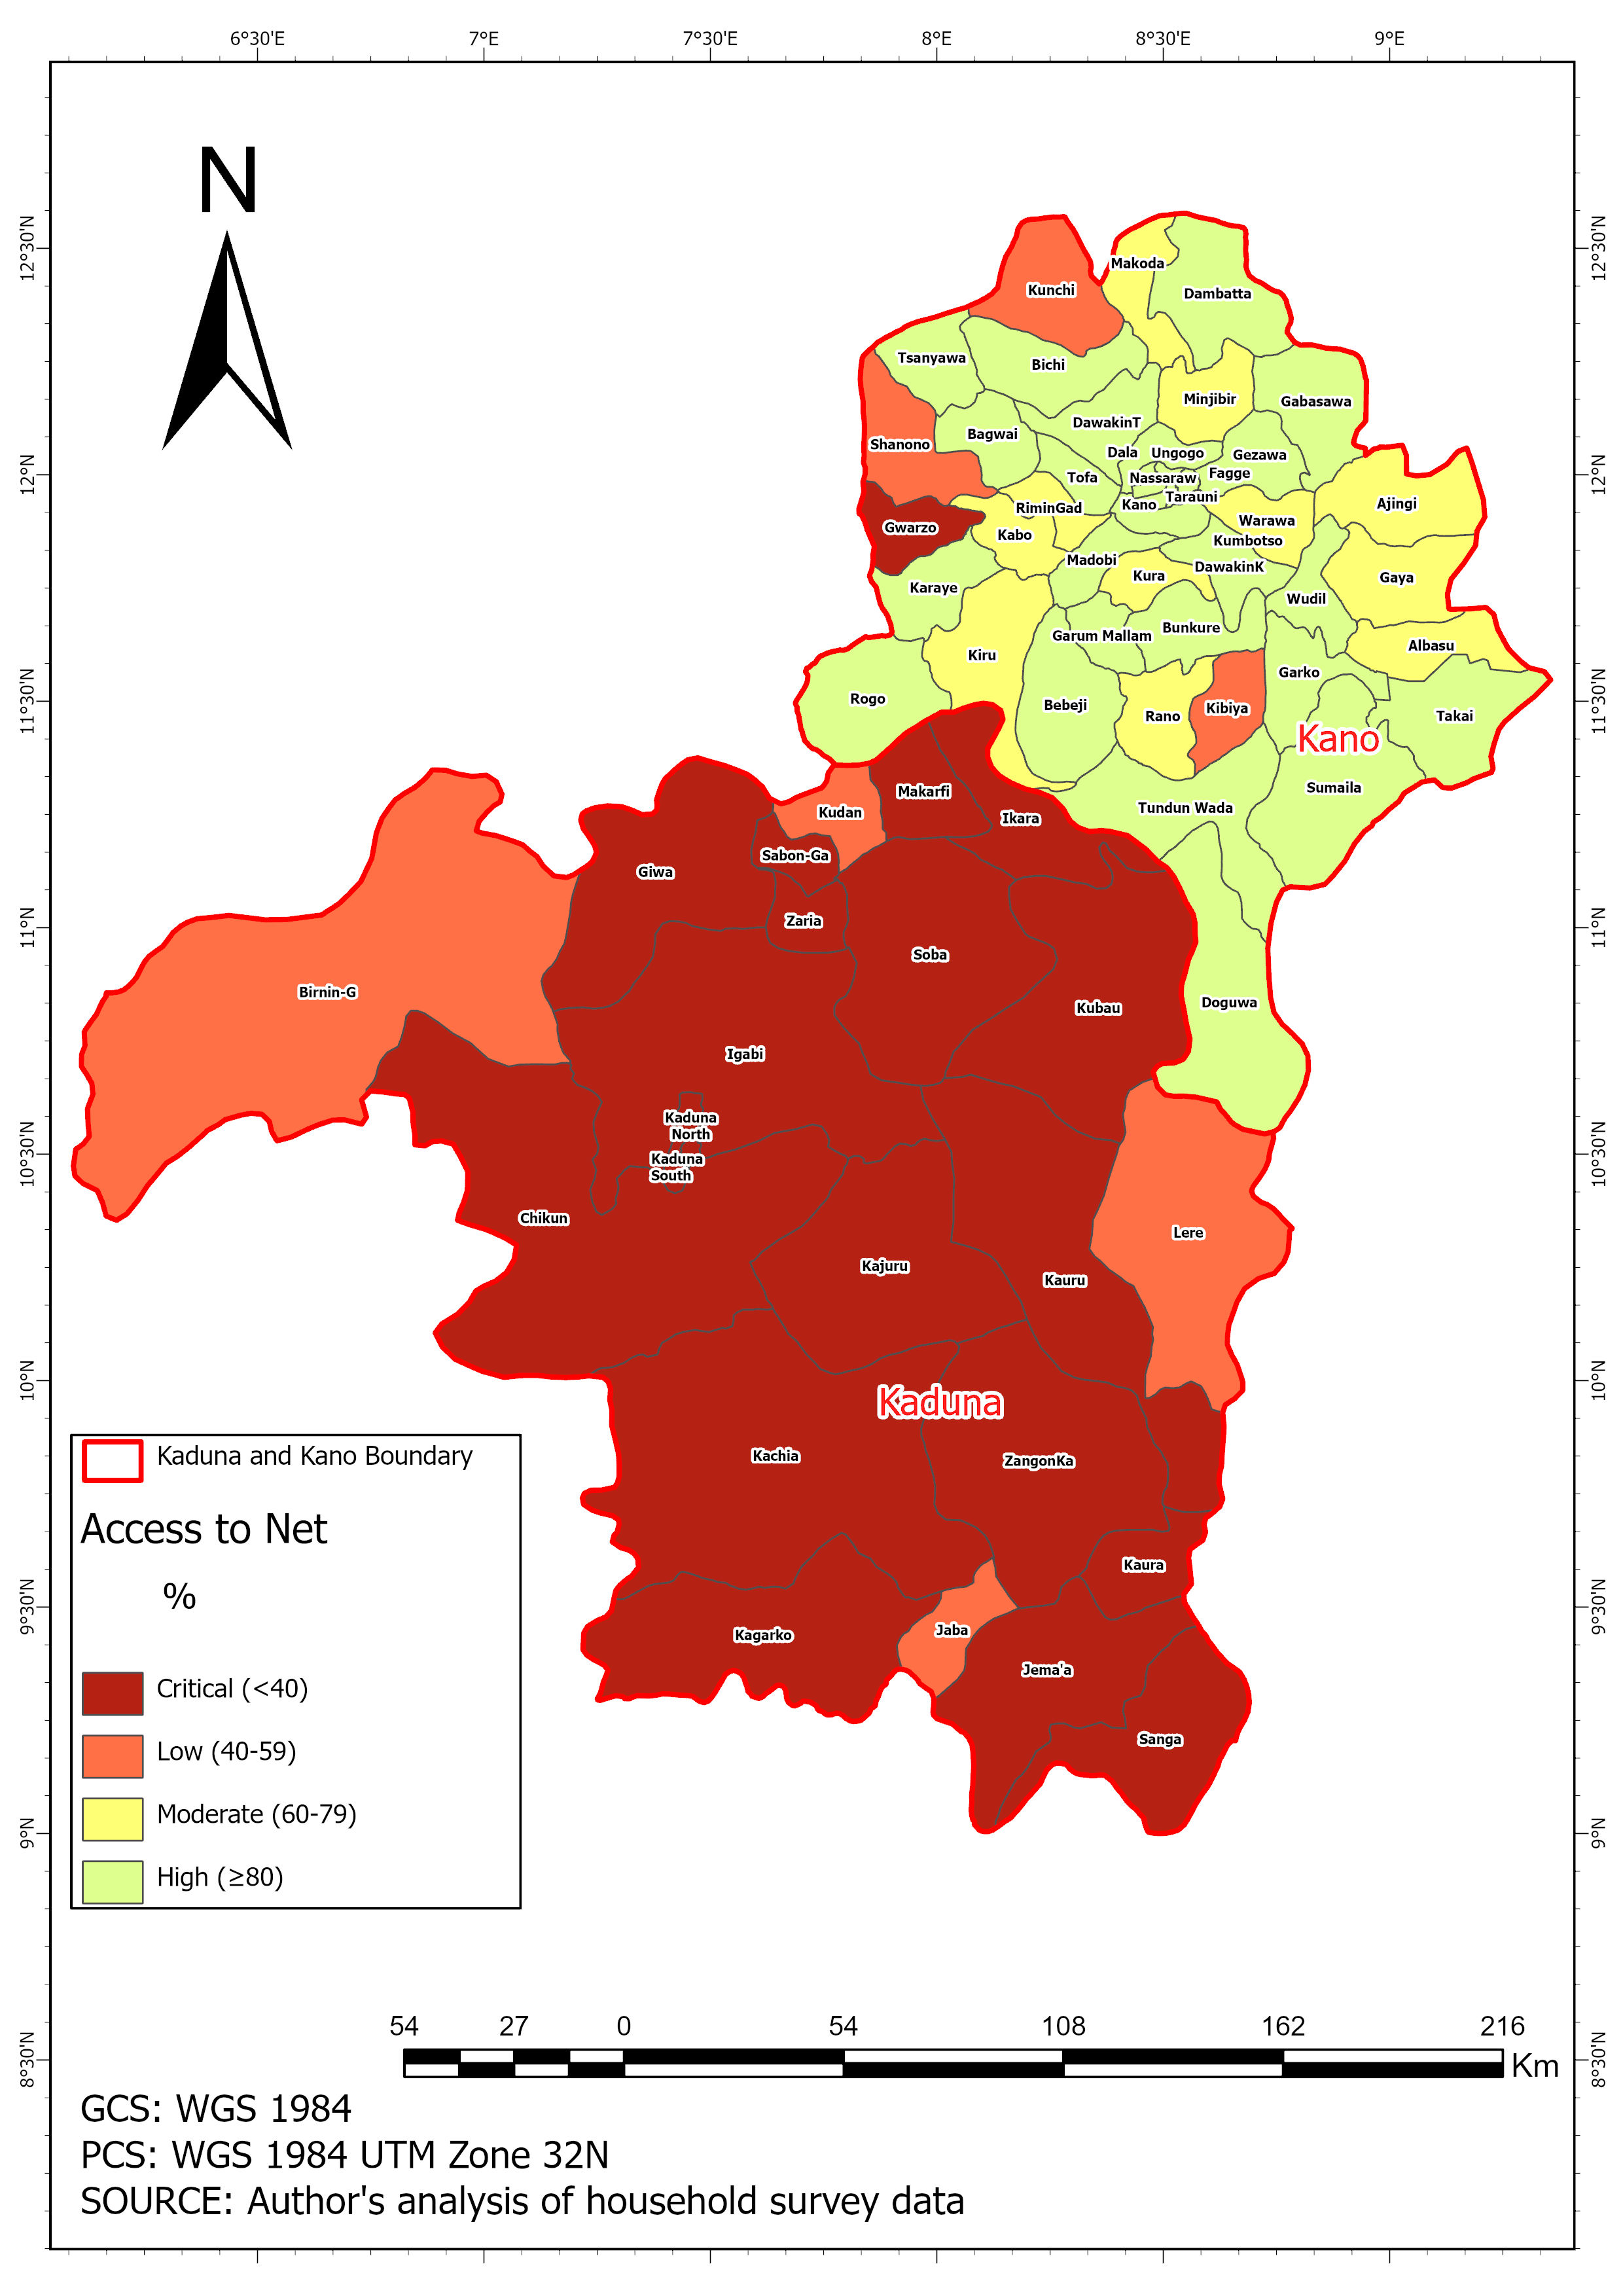
Indicator 02
Access to Net
Critical (<40%) to High (≥80%)
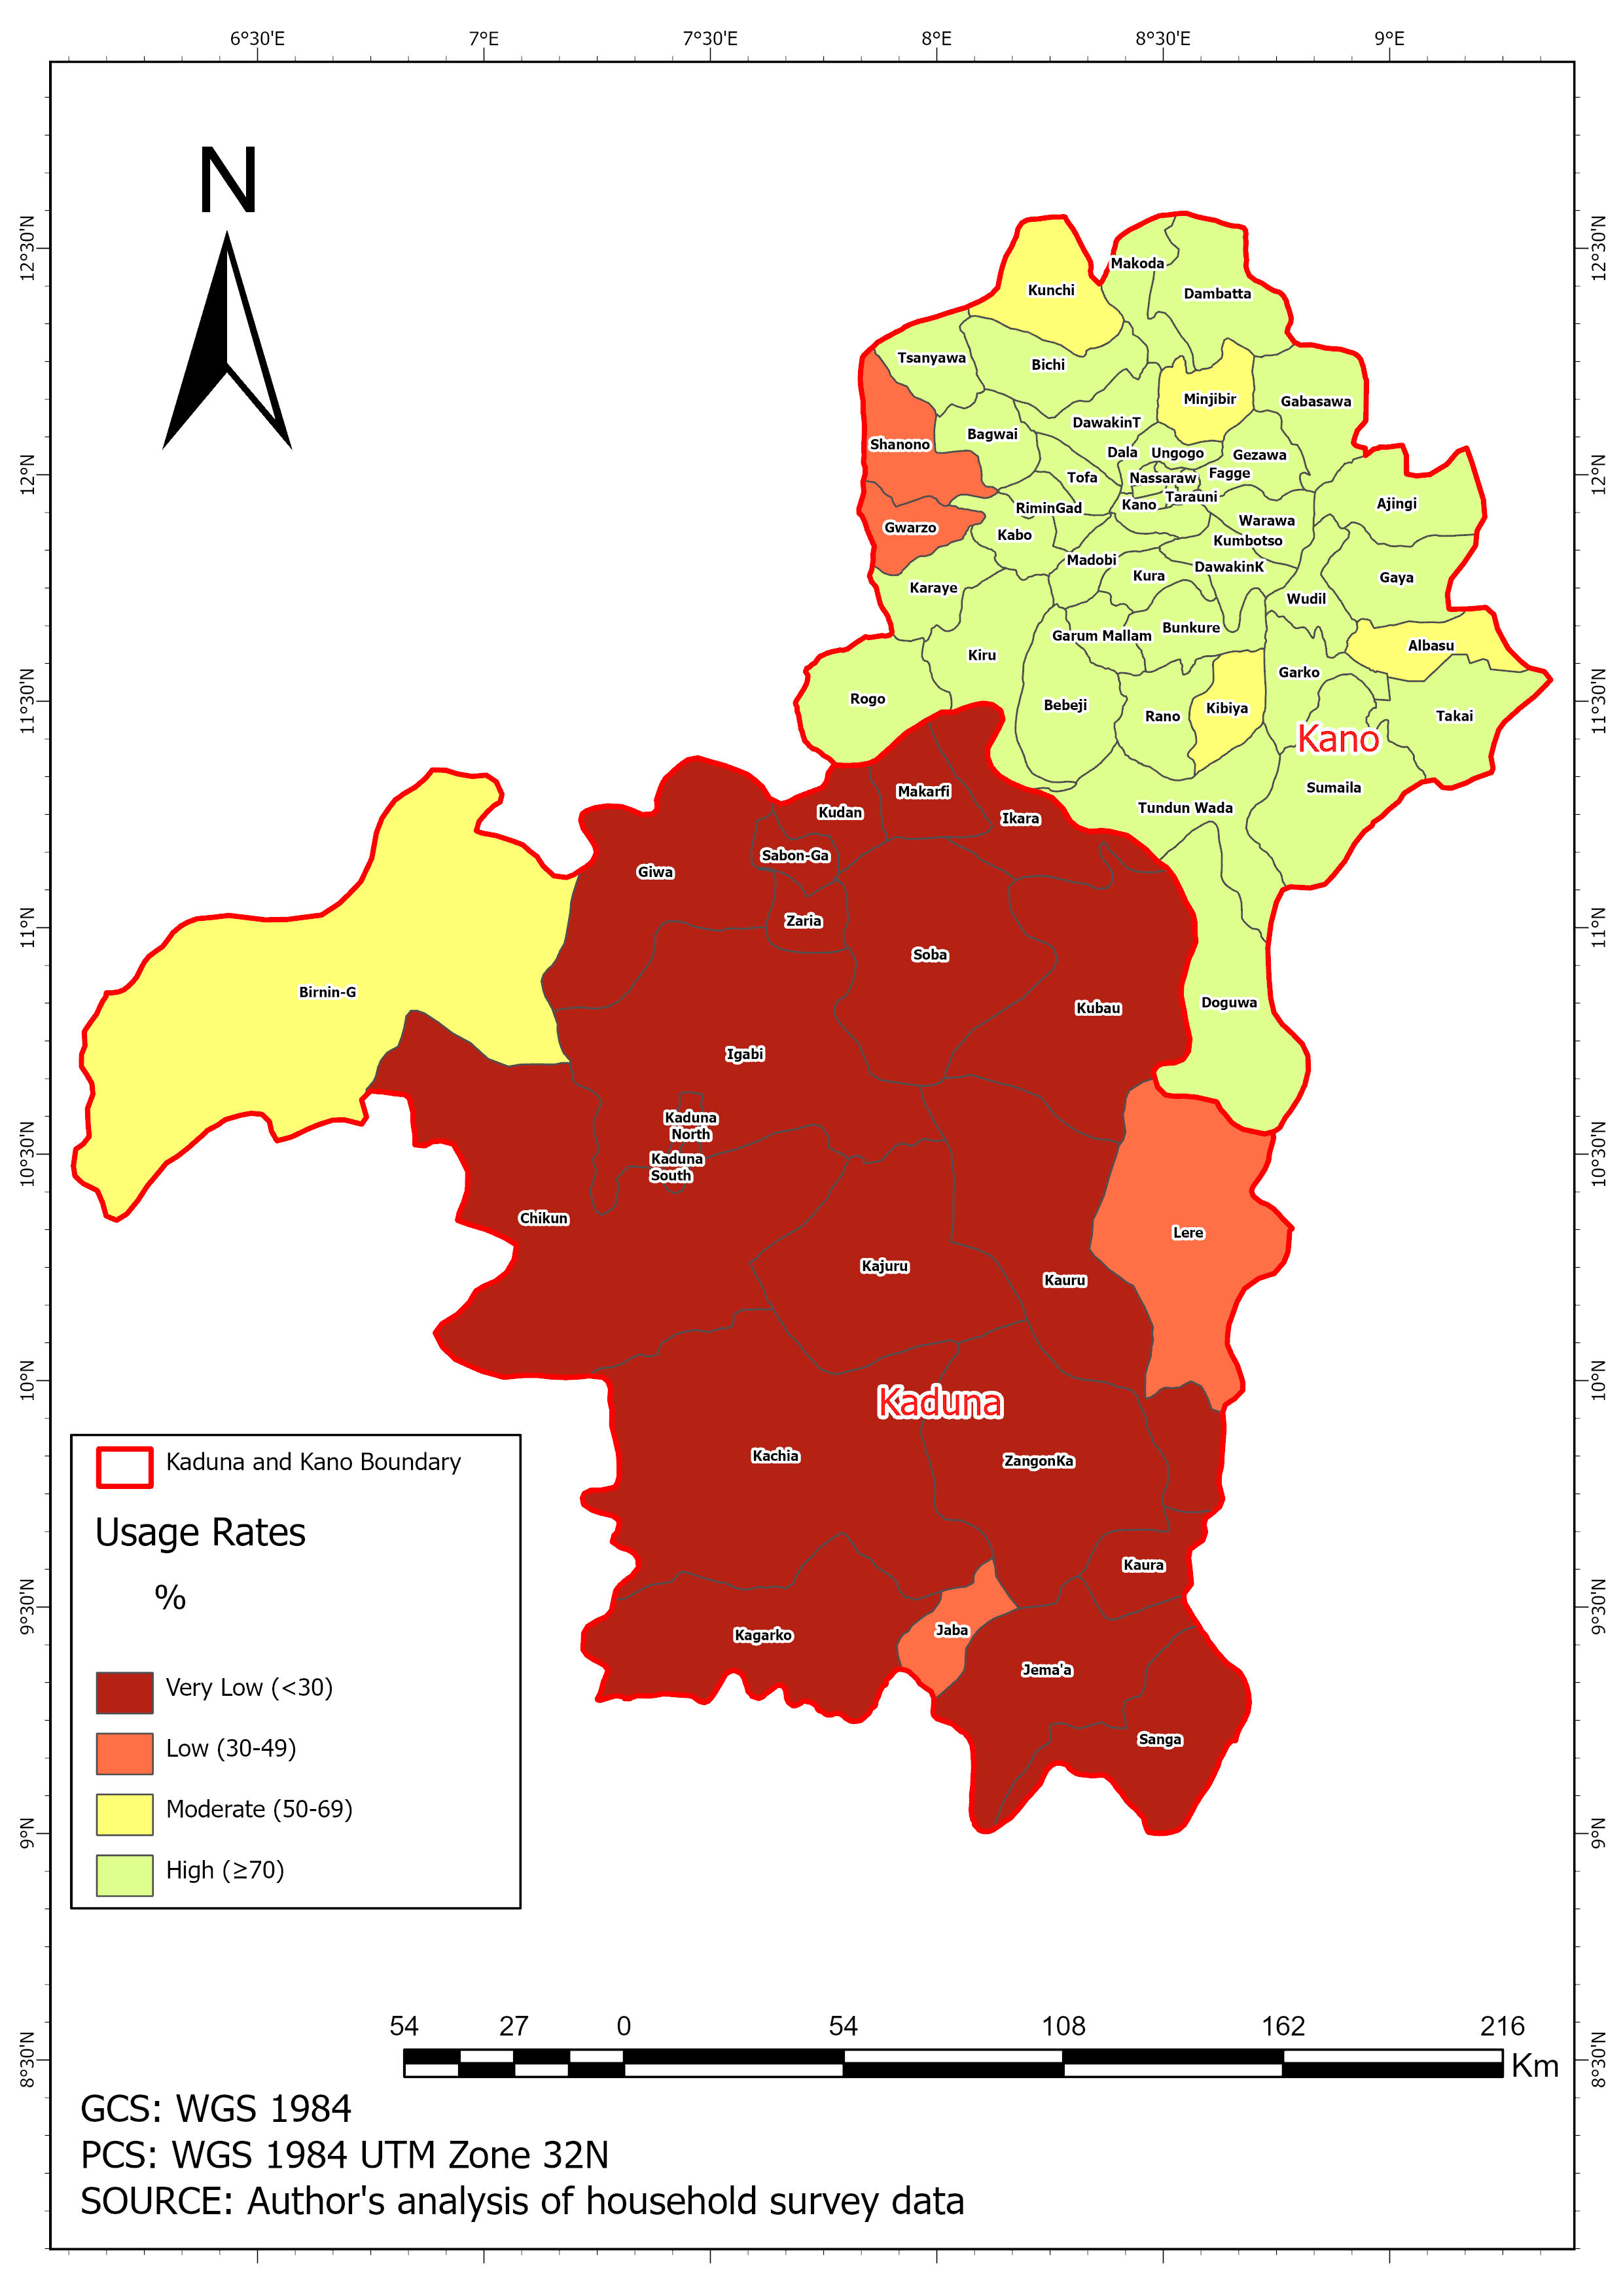
Indicator 03
Usage Rate
Very Low (<30%) to High (≥70%)
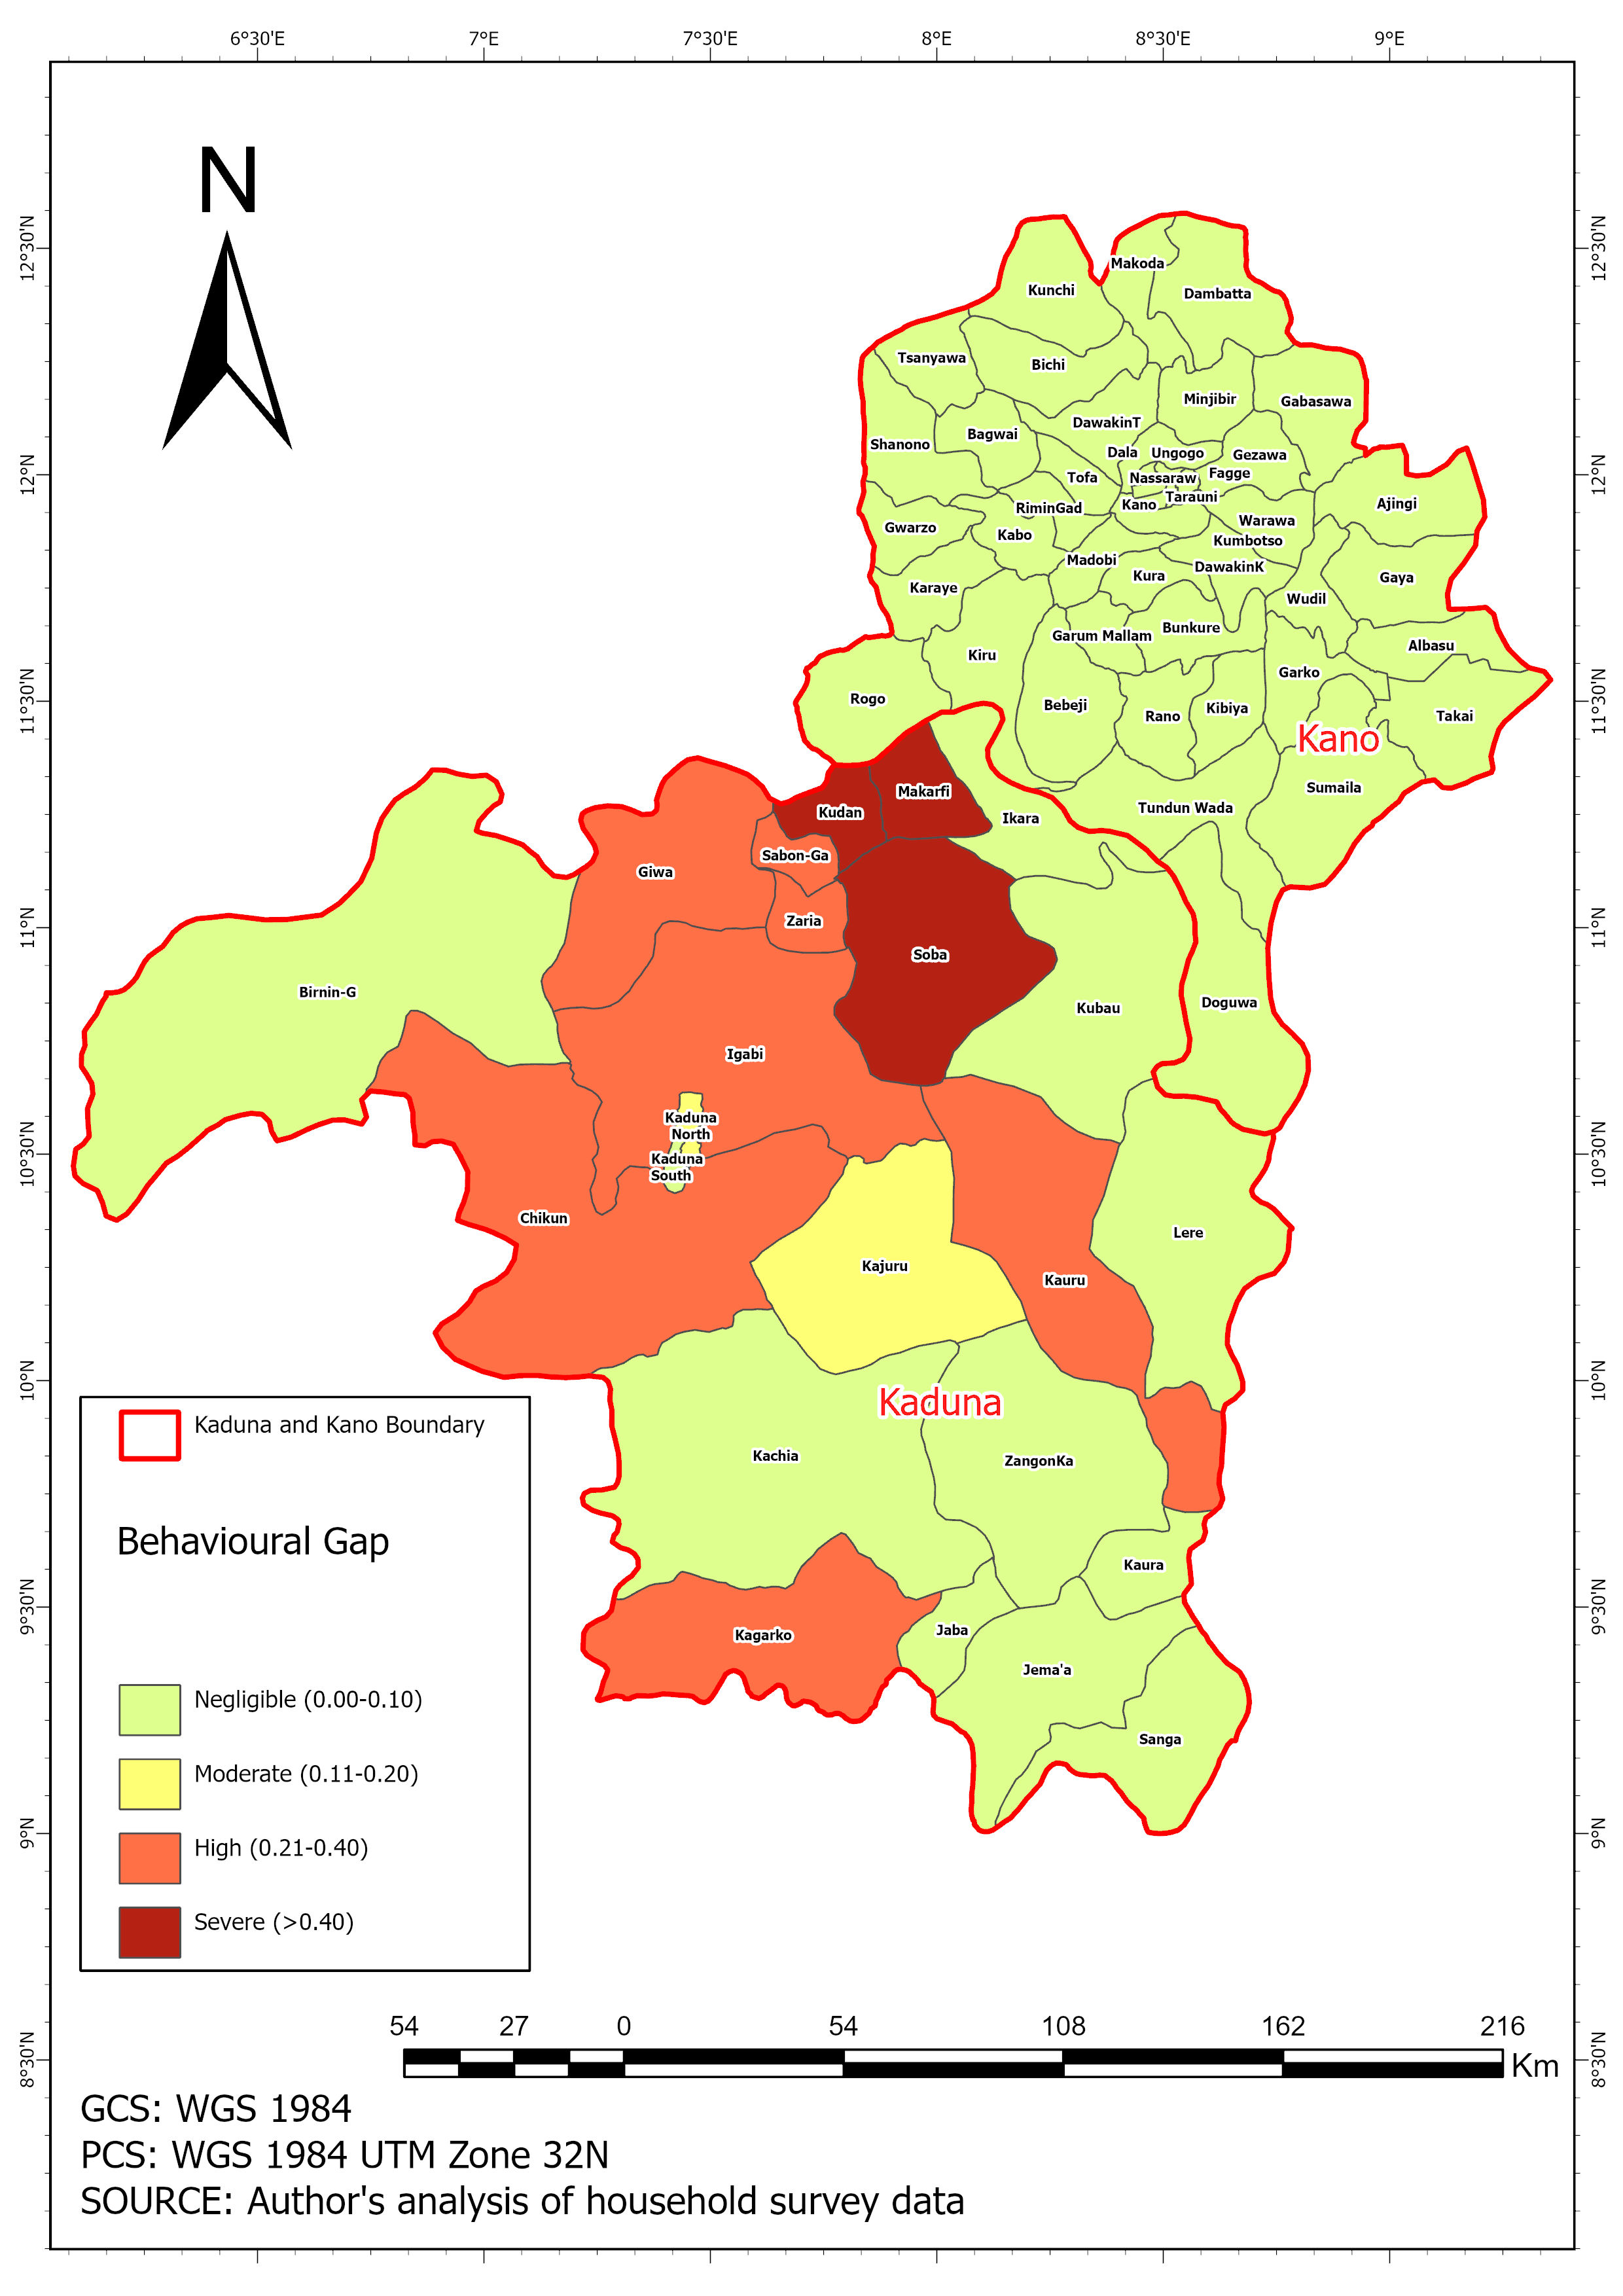
Indicator 04
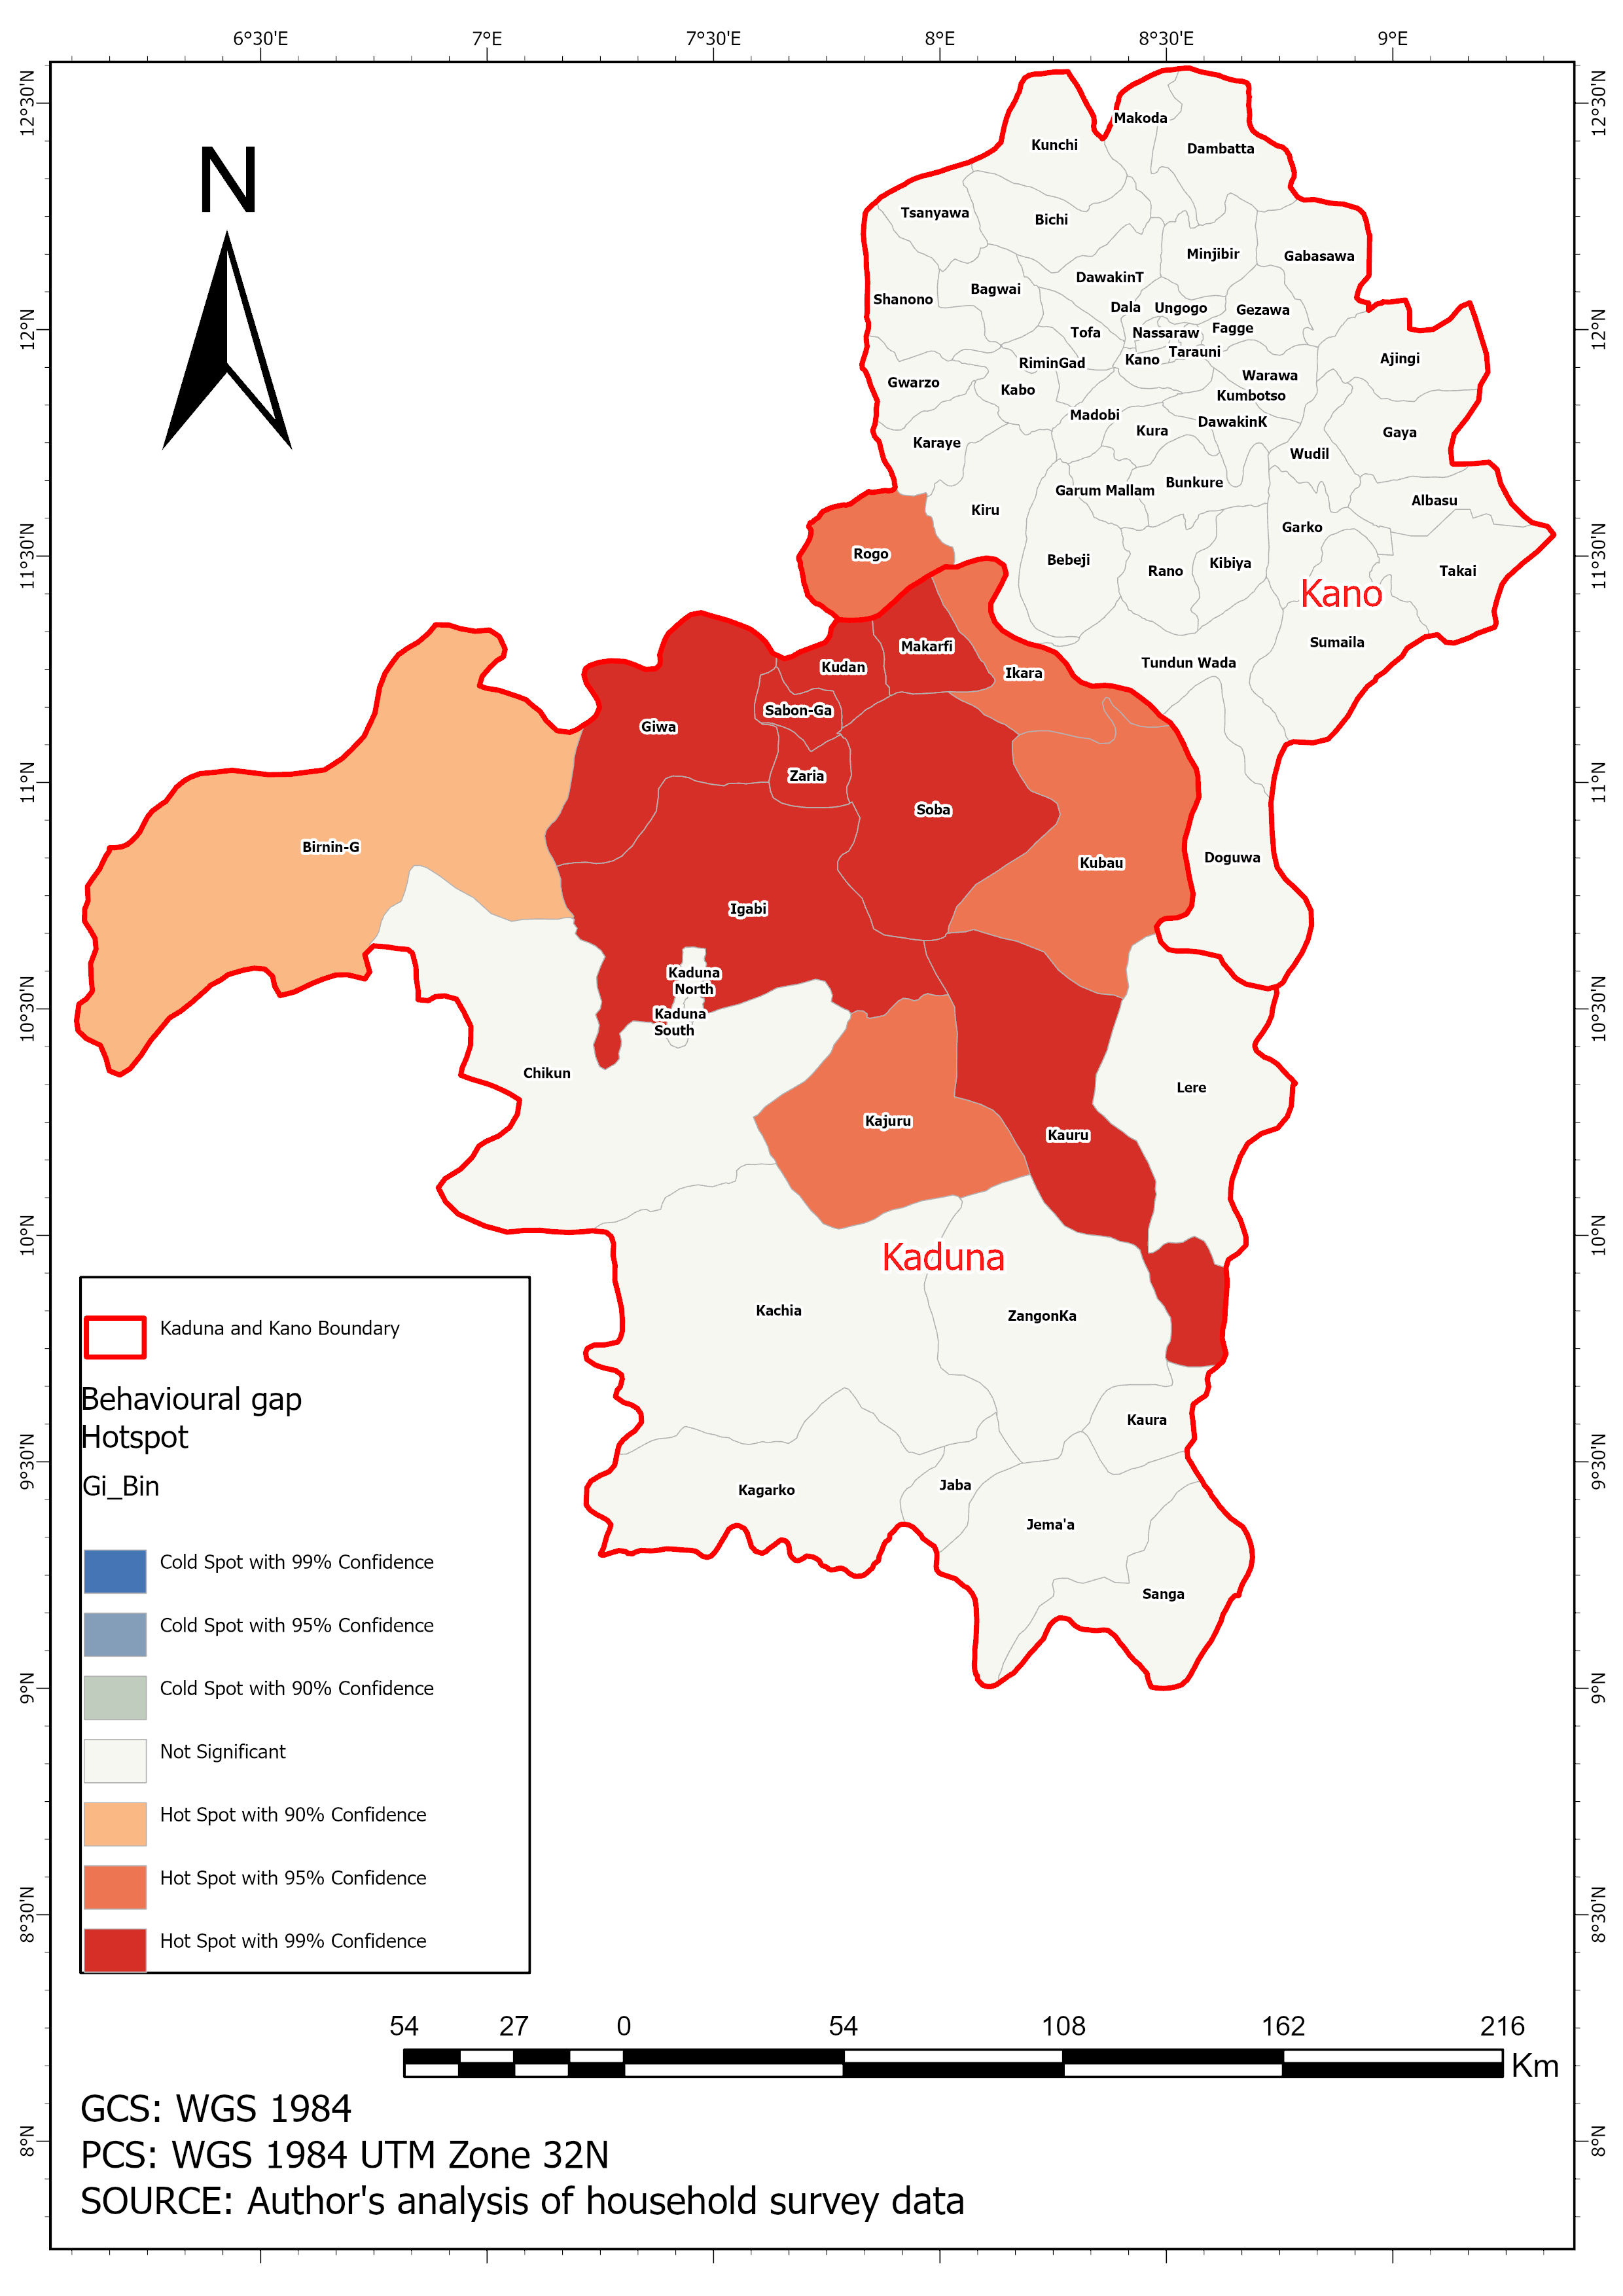
Behavioural Gap
Negligible (0.00–0.10) to Severe (>0.40)
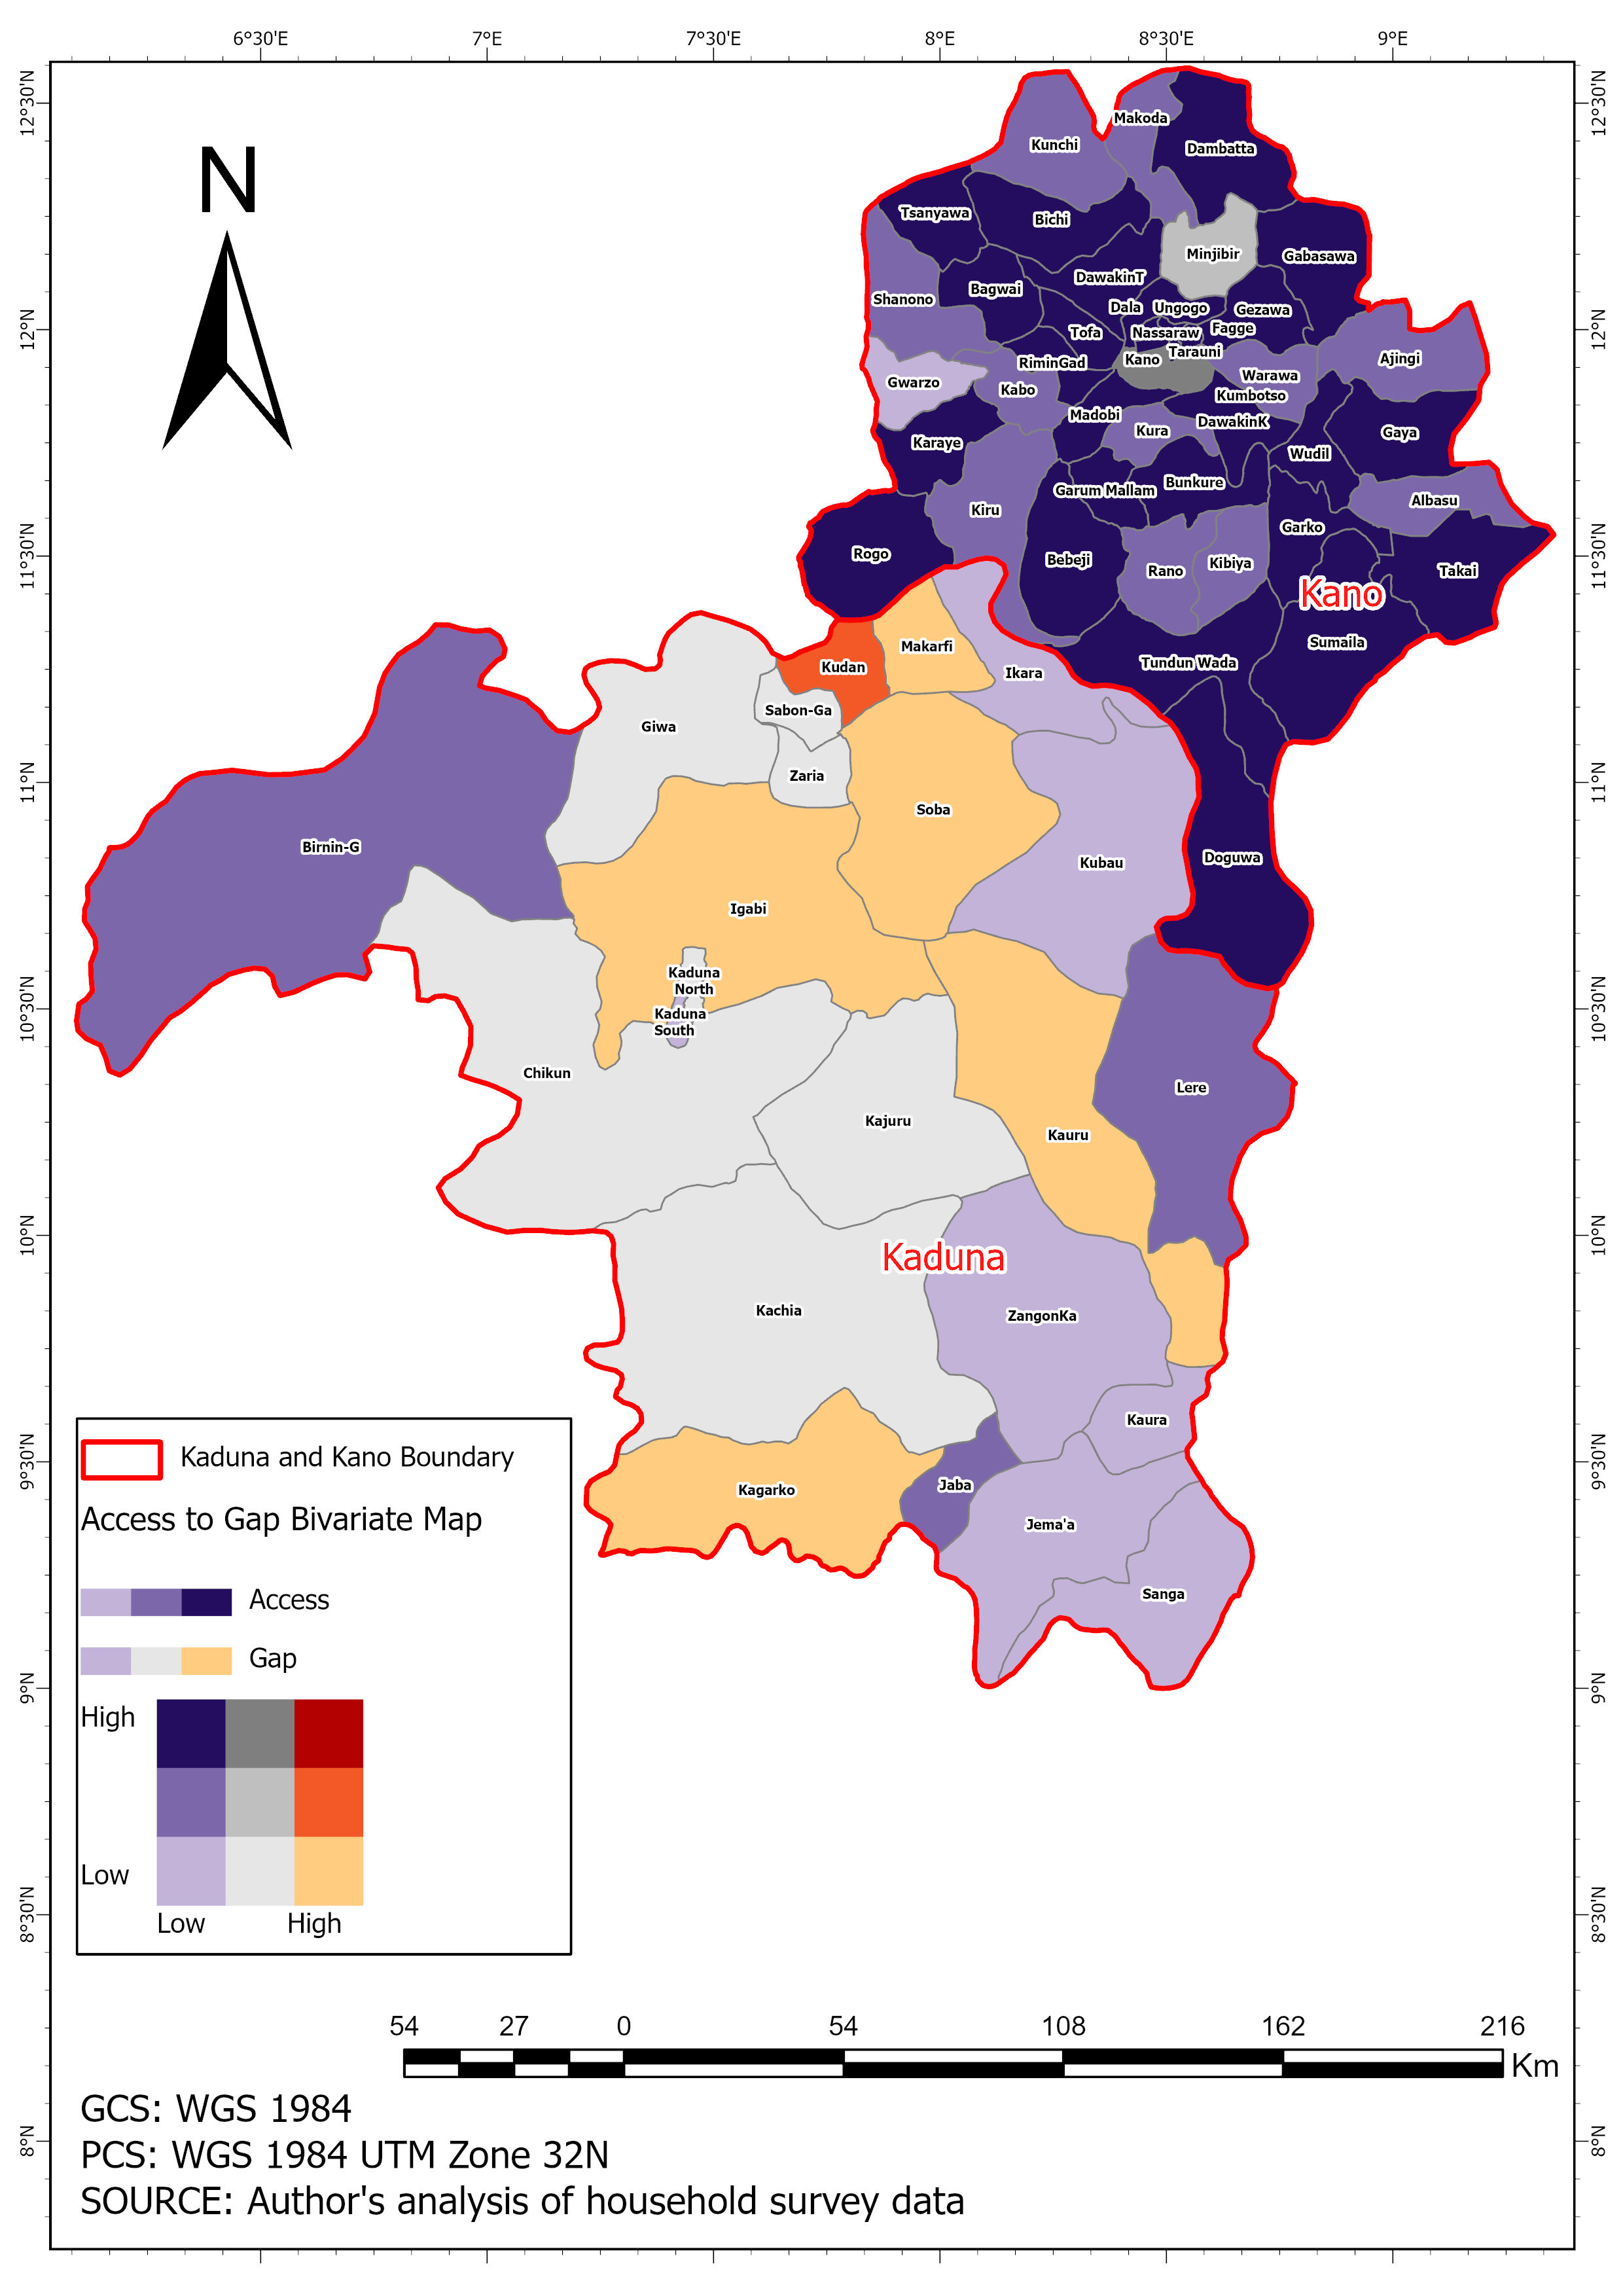
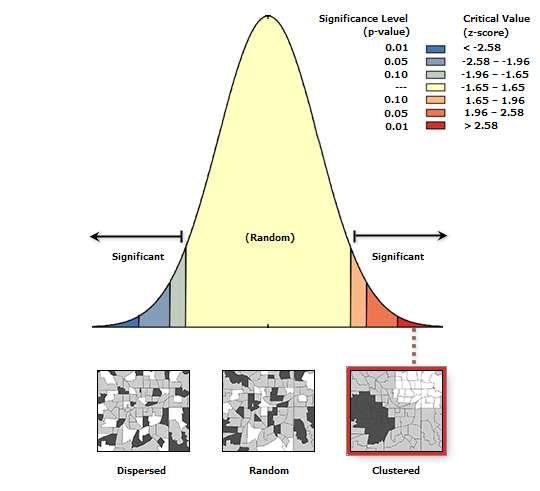
Bivariate Analysis
Access vs. Behavioural Gap
Four programmatic typologies by LGA