Precision Agriculture · Soil Science · GIS

Soil Nutrient & Land Suitability Mapping
Ikere Area, Oyo State

Study AreaIkere Area, Oyo State
Scale1:50,000
Sample Grid700m spacing — 139 sample points
ClientIAR&T, Obafemi Awolowo University
Year2025
139Soil sample points
5Nutrient parameters
3Crop suitability maps
6,770Hectares surveyed
14Maps produced

Background & Objectives

This comprehensive land evaluation survey was carried out for IAR&T across the Ikere area of Oyo State to support agricultural planning for a proposed farmland. The study covered approximately 6,770 hectares sampled at a 700m grid spacing, yielding 139 georeferenced soil sample points.

The analysis characterized the soil's physical and chemical properties — nitrogen, phosphorus, potassium, organic carbon, calcium, soil depth, and texture — and translated these into practical land suitability assessments for three priority crops: maize, rice, and soybean. An erosion risk assessment and fertility capability classification were also produced.

All spatial interpolation was performed using Inverse Distance Weighting (IDW). IDW was preferred over kriging because it preserves actual measured values at sample locations without over-smoothing, faithfully representing the field reality. Kriging applies statistical smoothing that can mask localized nutrient variability which is agronomically critical for site-specific management decisions.

The geological and hydrological context of the study area — dominated by Migmatite with minor occurrences of Fine and Medium-grained Biotite granite, Silicified Sheared rocks, and undifferentiated Schist — directly influences soil parent material and therefore nutrient distribution across the landscape.

Location & geological context

Location Map of Proposed Farmland, Ikere Area
Location
Location Map — Proposed Farmland, Ikere Area
Elevation: 232–351m · 5 elevation classes · 700m sample grid
Geological and Hydrological Map, Ikere Area
Geology & Hydrology
Geological & Hydrological Map
4 rock types: Migmatite (dominant), OGF, qS, Undifferentiated Schist

Soil classification & physical properties

Soil Map of Ikere Area
Soil Classification
Soil Map
8 series: Chromic Lixisols, Petroferric Lithosols, Ferric Lixisol, Eutric Fluvisol, Eutric Cambisol, Plinthic Cambisol, Ferric Lixisol (Woro), Plinthosol
Soil Depth Map of Ikere Area
Physical Property
Soil Depth
Very Shallow 0.68% · Shallow 18.92% · Moderately Deep 67.91% · Deep 12.5%

Nutrient distribution maps

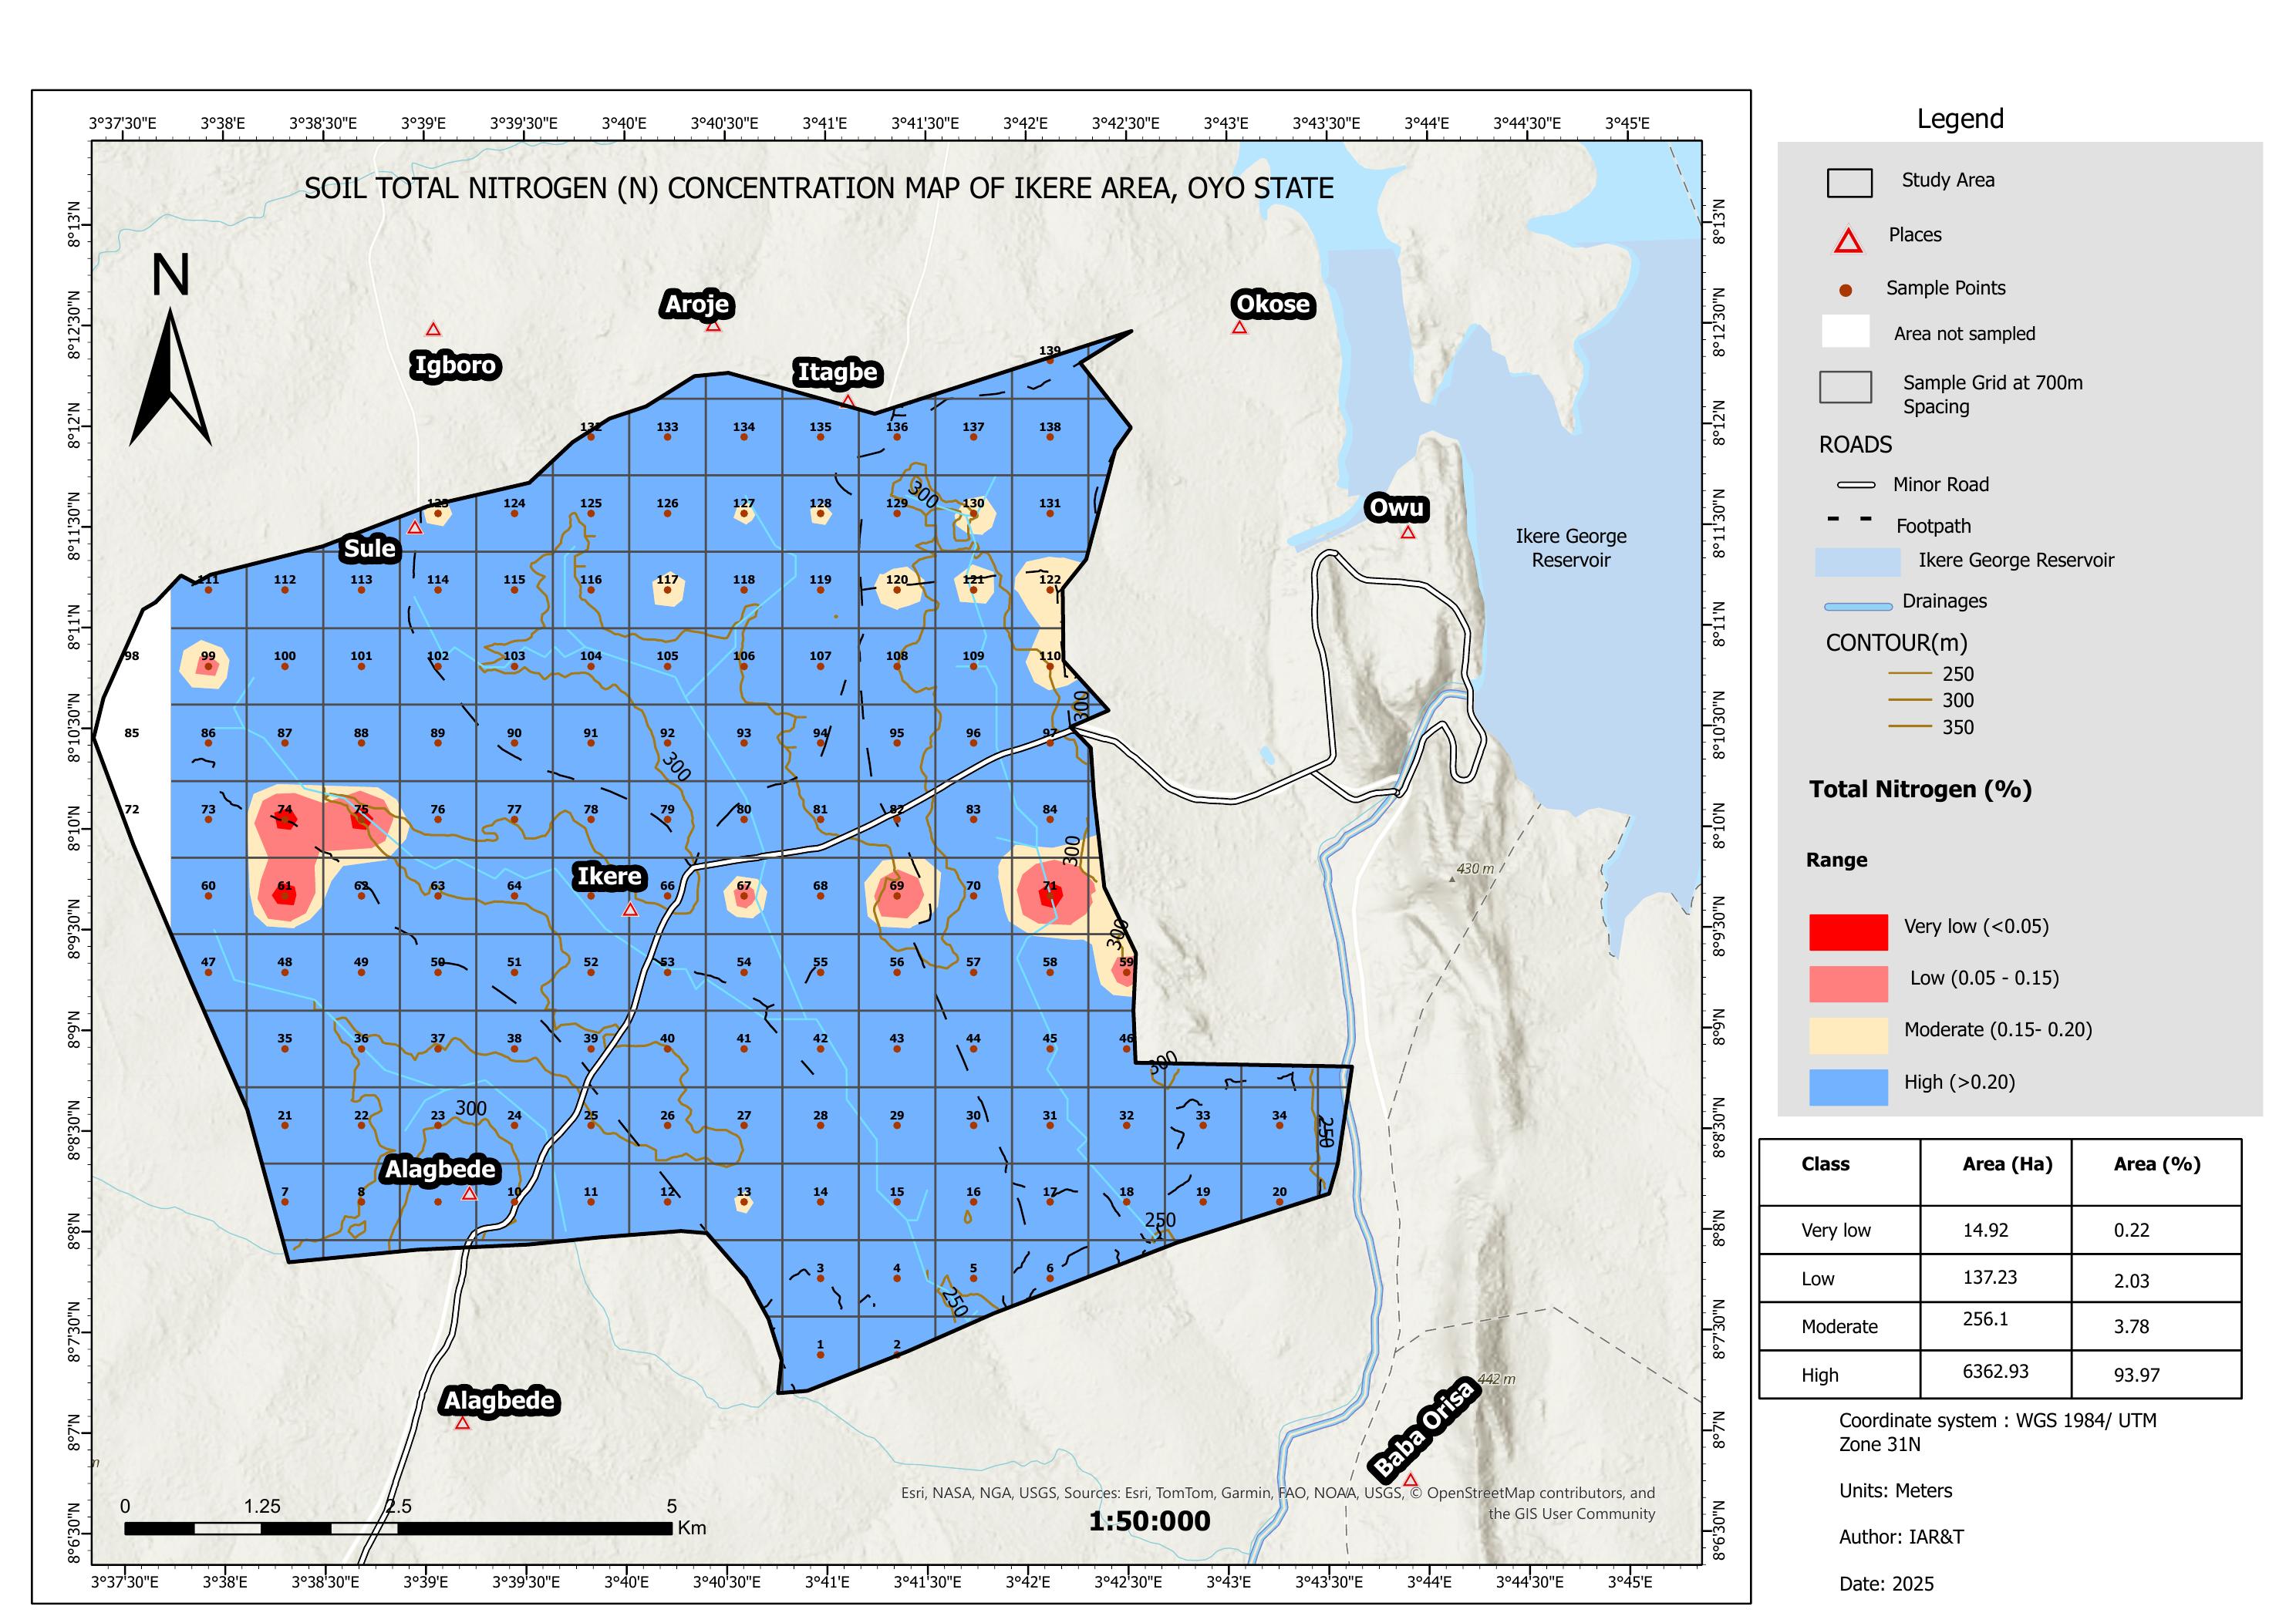
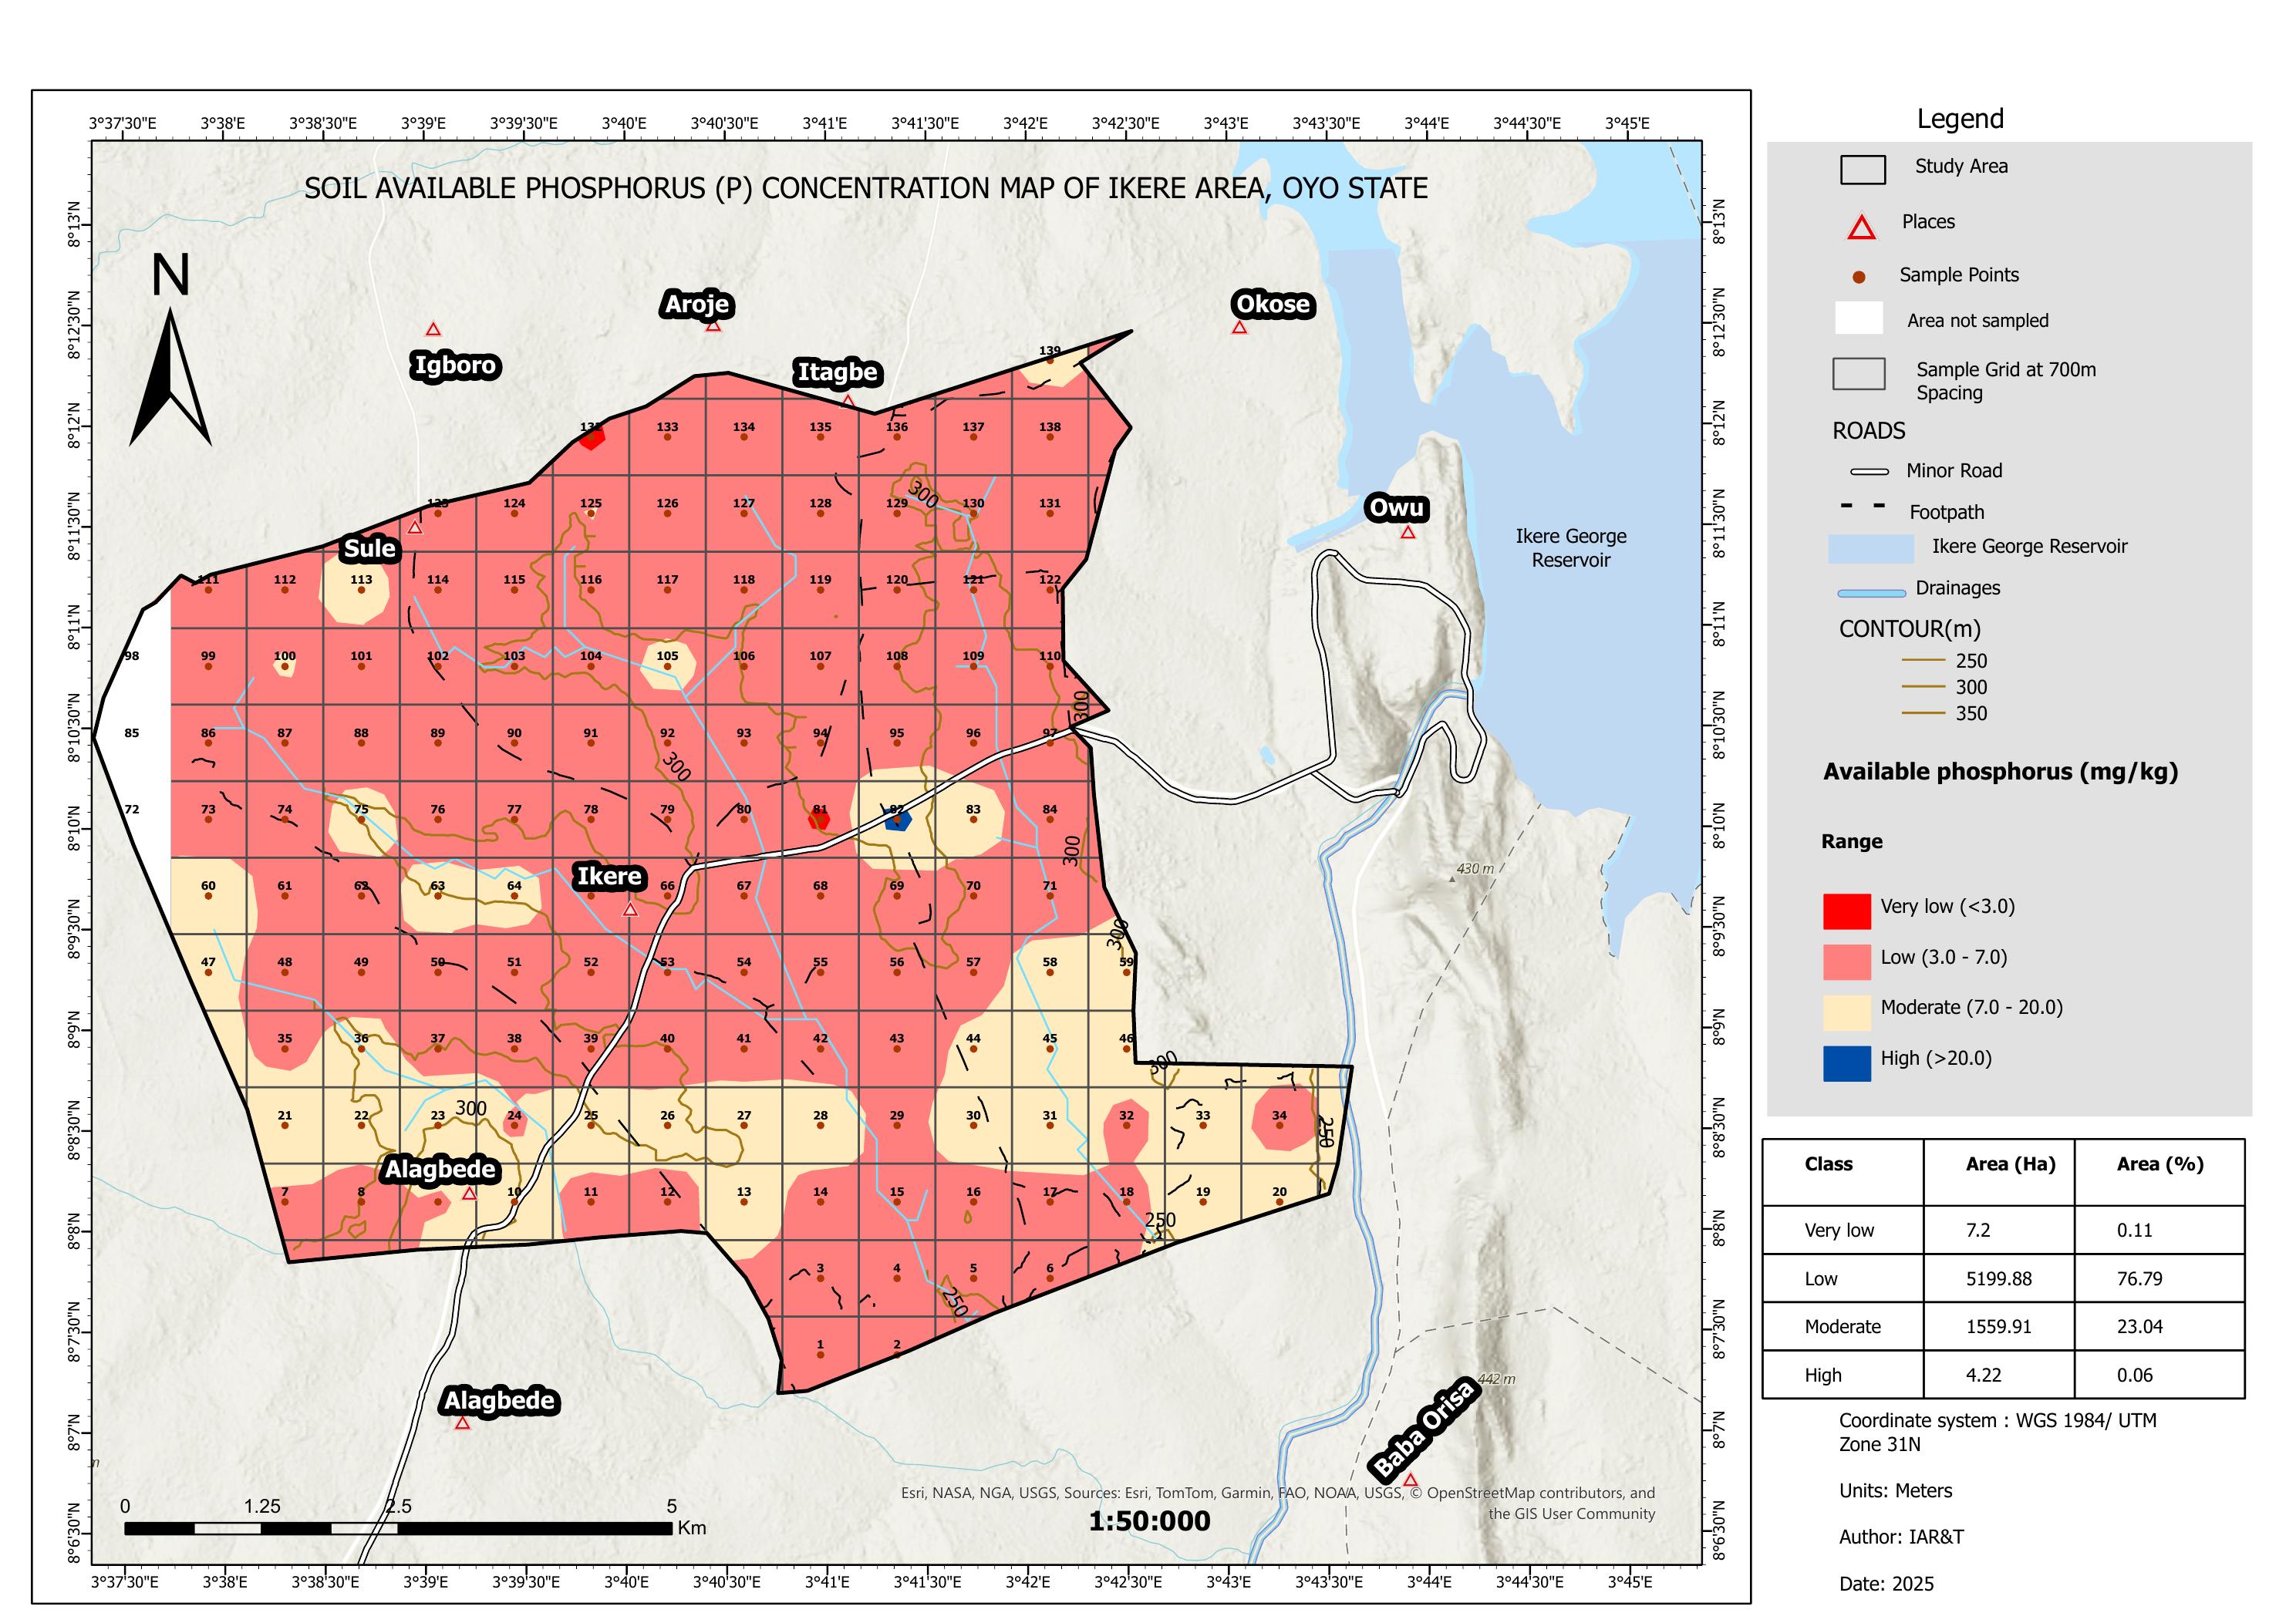
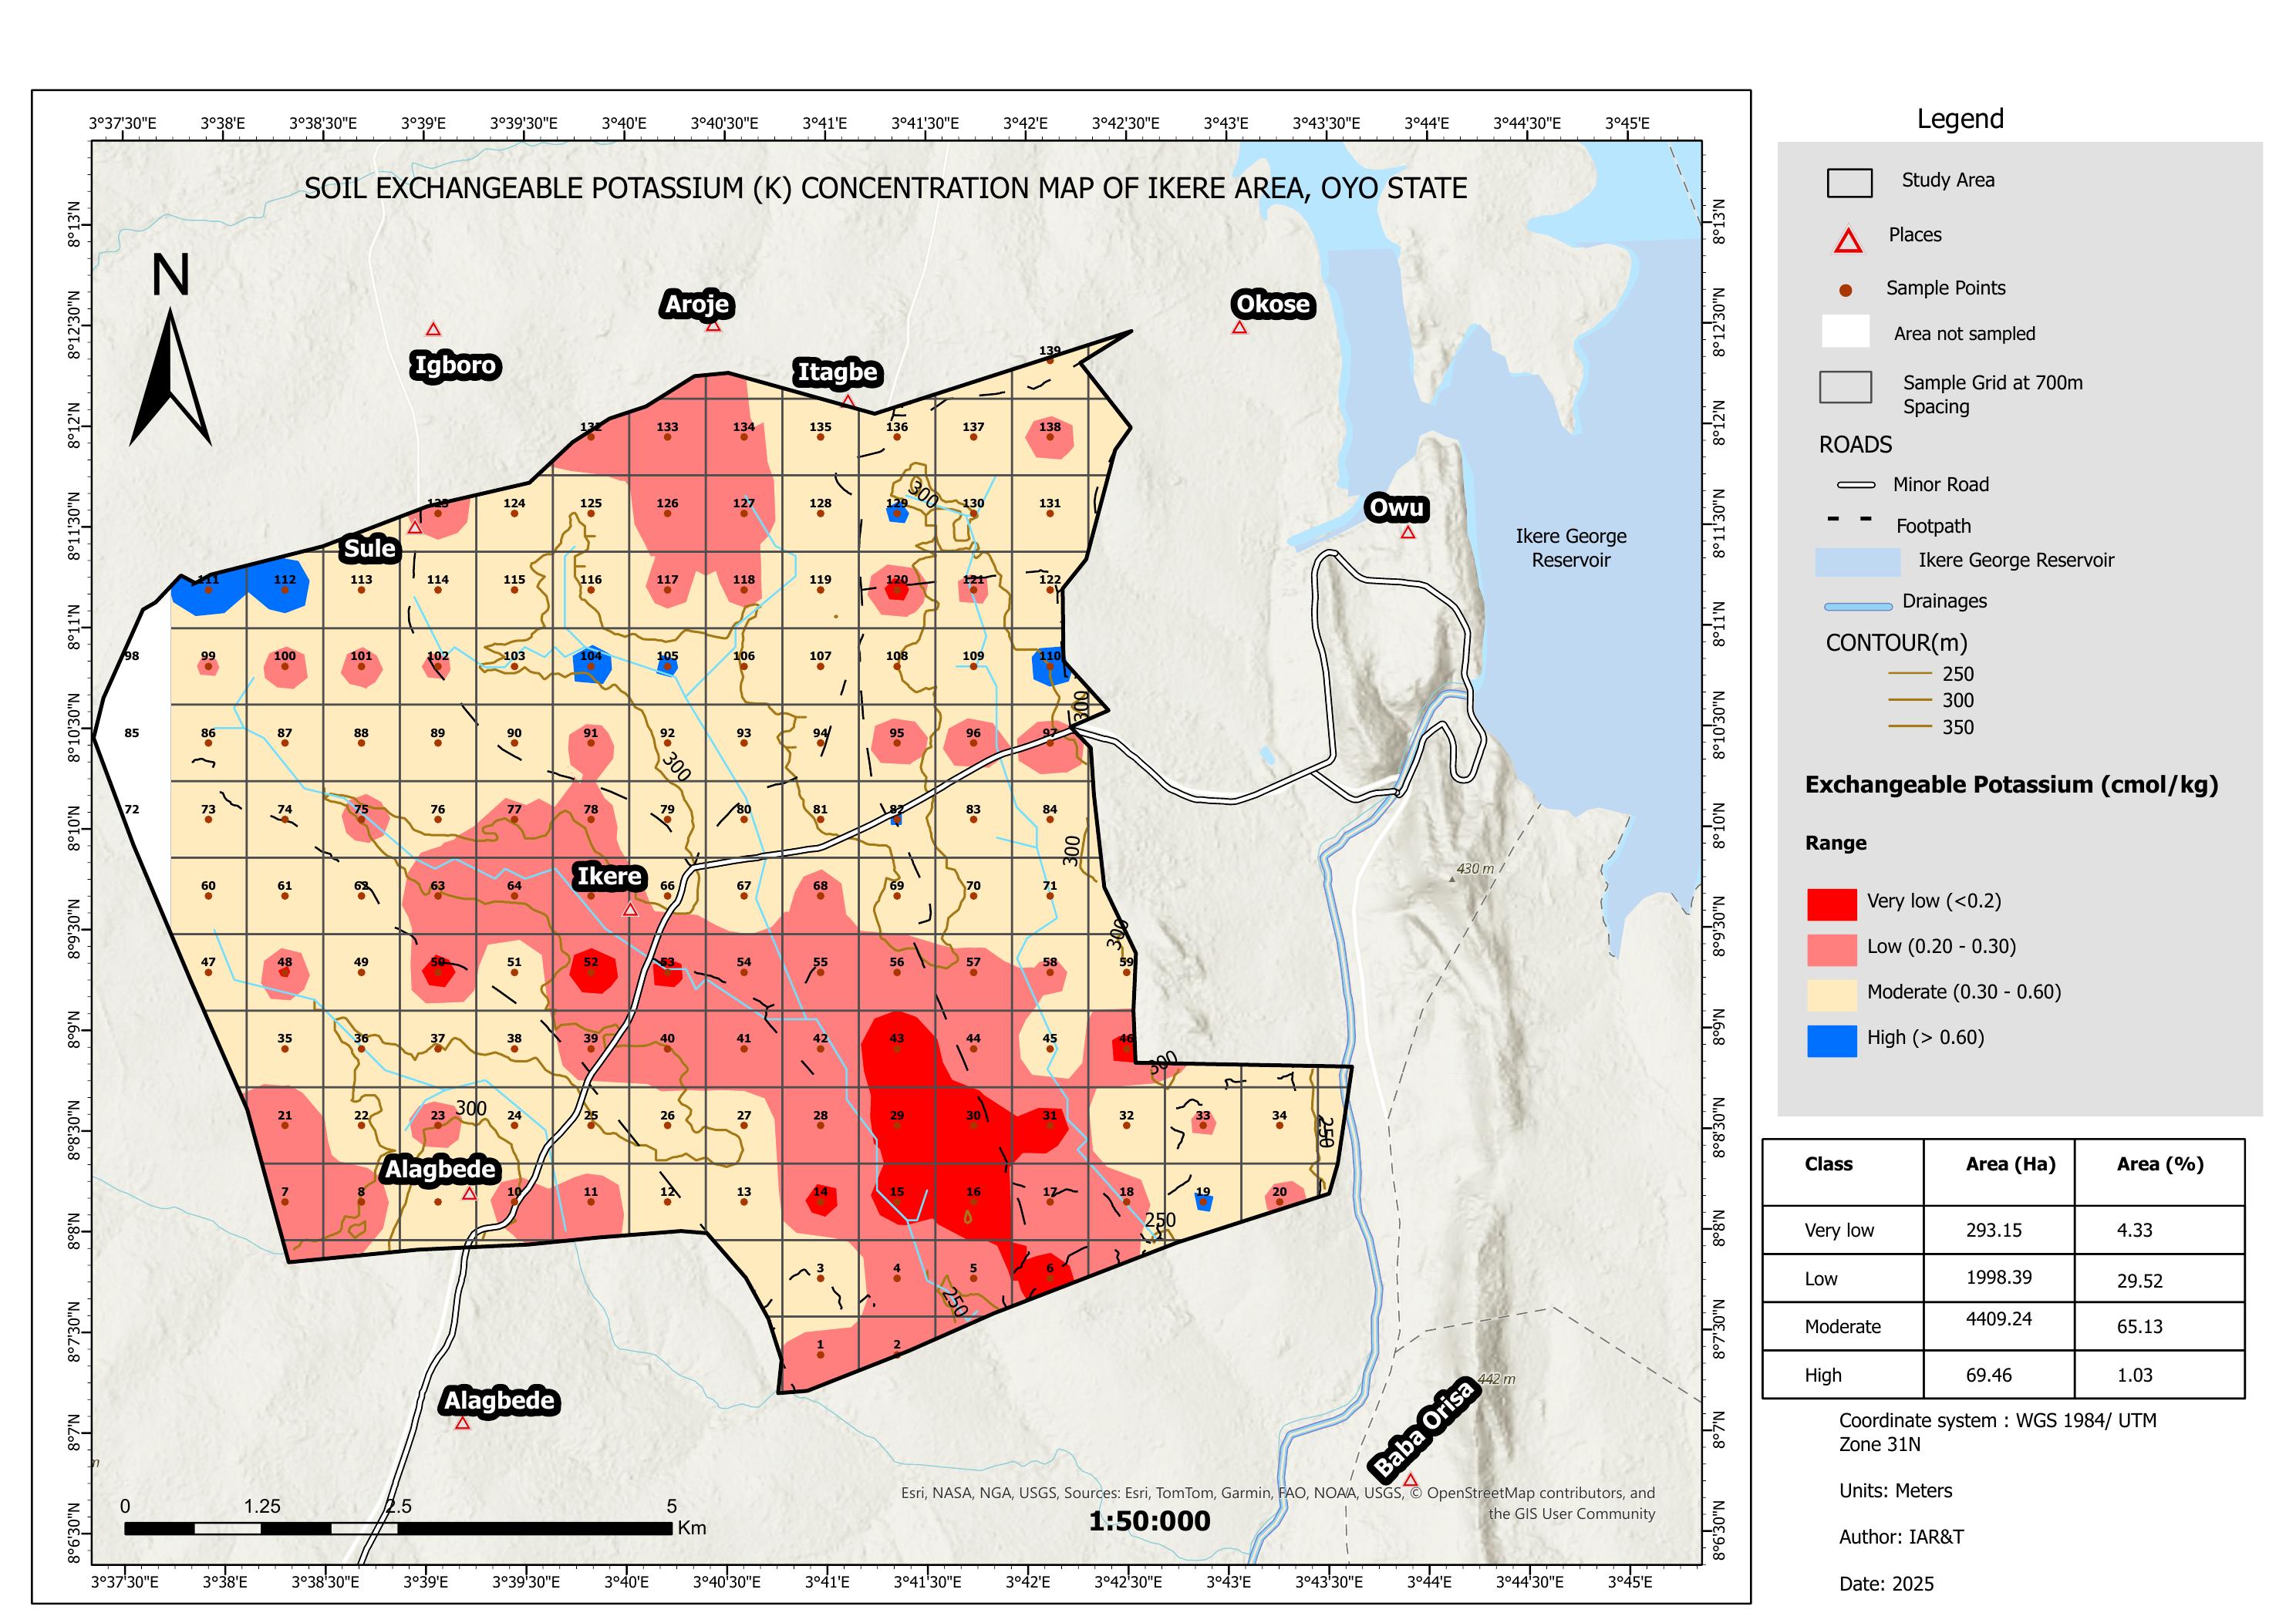
Five key soil chemical parameters were mapped using IDW interpolation. The results reveal a landscape largely adequate in organic carbon and nitrogen but significantly deficient in available phosphorus — a critical finding for fertilizer management planning.

Why IDW over Kriging?

IDW was selected because it honours actual measured values at sample points, making the interpolated surface directly traceable to field observations. Kriging applies a statistical model that smooths values between sample locations, which can mask localized nutrient hotspots and deficiency pockets that are exactly what agronomic management needs to detect. For soil nutrient mapping at this grid density, IDW produces a more faithful and actionable representation of spatial variability across the study area.

ParameterDominant ClassCoverageAgronomic Implication
Organic CarbonHigh (>1.4%)98.11%Good soil organic matter status across most of the area
Total NitrogenHigh (>0.20%)93.97%Adequate nitrogen levels; localized deficiencies in 6% of area
Available PhosphorusLow (3.0–7.0 mg/kg)76.79%P deficiency widespread — phosphate fertilization recommended
Exchangeable PotassiumModerate (0.30–0.60 cmol/kg)65.13%Moderate K status; supplementation needed in 34% of area
Exchangeable CalciumModerate (5.19–8.41 cmol/kg)85%Generally adequate; low Ca patches in western portions
Organic Carbon Map
Nutrient Map
Organic Carbon
98.11% High (>1.4%)
Total Nitrogen Map
Nutrient Map
Total Nitrogen
93.97% High (>0.20%)
Available Phosphorus Map
Nutrient Map
Available Phosphorus
76.79% Low (3.0–7.0 mg/kg)
Exchangeable Potassium Map
Nutrient Map
Exchangeable Potassium
65.13% Moderate (0.30–0.60 cmol/kg)
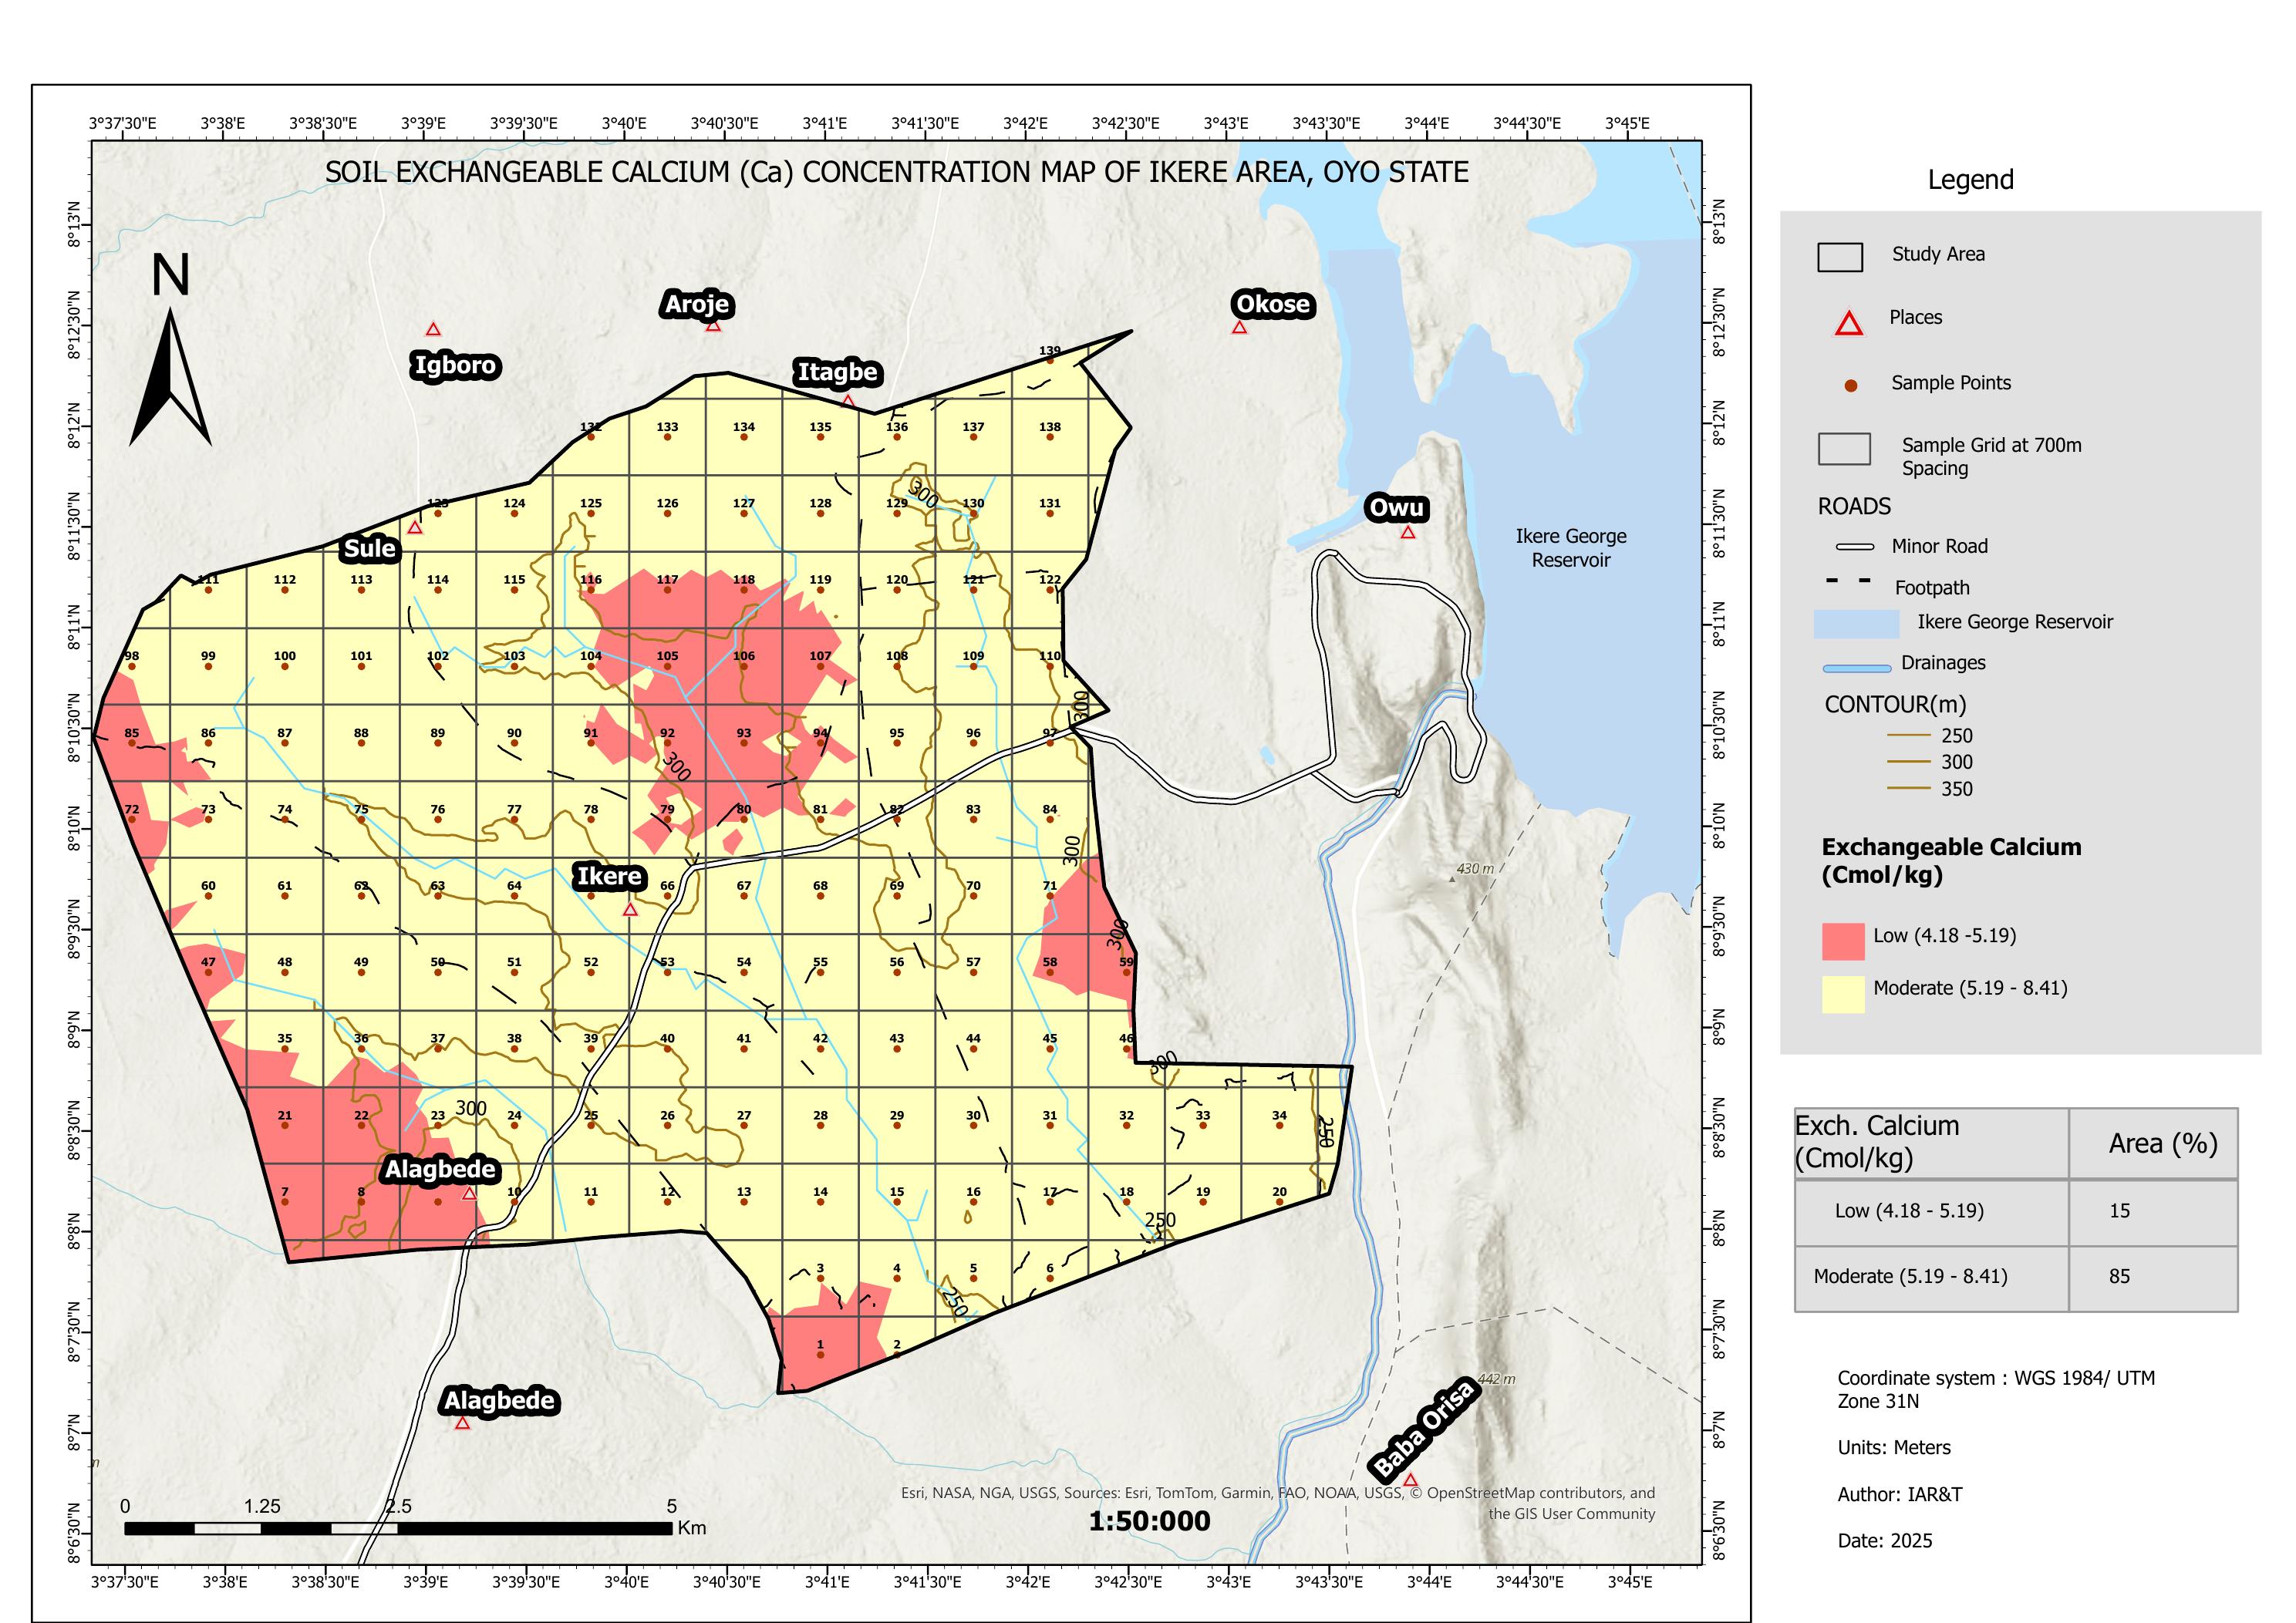
Exchangeable Calcium Map
Nutrient Map
Exchangeable Calcium
85% Moderate (5.19–8.41 cmol/kg)

Erosion risk & fertility capability

Soil Erosion Risk Map
Erosion Risk (K Factor)
Soil Erosion Risk Map
Moderate 71.76% (4,858 Ha) · High 22.83% (1,546 Ha)
Fertility Capability Classification Map
FCC System
Fertility Capability Classification
7 FCC classes — L, L", L"R, L'(15%), L/LR, LiR, Lig

Crop suitability assessment

Using the FAO land suitability framework, soil physical and chemical properties were evaluated against the requirements of three priority crops. Suitability classes range from S1 (highly suitable) through S2 (moderately suitable with limitations) to S3 (marginally suitable) and N1 (not suitable due to wetness constraints).

Maize Suitability Map
Crop Suitability
Maize Suitability
8 suitability classes · N1w, S2fe-2, S2g, S2ge-2, S2s, S2sgfe-1, S3sfe3, S3stf
Rice Suitability Map
Crop Suitability
Rice Suitability
8 suitability classes · S1 zones in eastern corridor
Soybean Suitability Map
Crop Suitability
Soybean Suitability
7 suitability classes · N1w, S2fe-2, S2g, S2ge-2, S2s, S2sfe-3, S2sgfe-1, S3fst

Analytical approach

Sampling design: A systematic grid sampling design was adopted at 700m spacing across the study area, yielding 139 georeferenced sample points. This spacing was selected to capture spatial variability at a scale relevant to farm management unit decisions.

Interpolation: IDW was applied to all nutrient parameters. The method assigns weights inversely proportional to distance, ensuring that closer sample points have greater influence on interpolated values. This preserves actual field measurements at sample locations without imposing statistical model assumptions.

Suitability evaluation: Land suitability was assessed using the FAO framework, matching soil physical properties (depth, texture, drainage) and chemical properties (nutrient levels, pH) against published crop requirement tables for maize, rice, and soybean.

Erosion risk: The K factor (soil erodibility) was computed from soil texture and organic matter data, then mapped to identify areas requiring soil conservation measures. Fertility Capability Classification was applied using the FCC system to provide a management-oriented characterization of soil limitations.

ArcGIS Pro ArcMap IDW Interpolation FAO Suitability Framework FCC System K Factor Analysis Systematic Grid Sampling Spatial Join Raster Classification

What the analysis revealed

P Deficient

Available phosphorus is critically low across 76.79% of the study area, making phosphate fertilization the single most impactful agronomic intervention for this farmland. Organic carbon and nitrogen are comparatively adequate, which is unusual and reflects the strong organic matter status of the soils.

22.83%

Over a fifth of the study area — 1,545 hectares — falls in the High erosion risk class based on K factor analysis. These areas, concentrated in the steeper portions of the study area, require soil conservation measures before intensive cultivation begins.

Rice East

The eastern corridor shows S1 (highly suitable) classification for rice, linked to the presence of Eutric Fluvisol (Jago series) soils associated with drainage channels. This spatial specificity demonstrates the value of detailed soil mapping over generic land assessment.

Migmatite

Migmatite dominates the geology of the study area, which is reflected in the predominantly Ferric and Chromic Lixisol soil types. The strong geological-soil relationship confirms that parent material is the primary control on spatial nutrient patterns — a finding that improves interpretability of the nutrient maps.

← Return to Portfolio